- Prism
FEATURES
Analyze, graph and present your workComprehensive analysis and statisticsElegant graphing and visualizationsShare, view and discuss your projectsLatest product features and releasesPOPULAR USE CASES
- Enterprise
- Resources
- Support
- Pricing
Prism 9.1.0 Release Notes
Prism 9.1.0 was released on March 16, 2021.
Introducing Prism Academy!
Prism Academy is GraphPad's online statistics and data visualization learning center. It contains over 125 videos and hours of learning material taught by highly-technical experts.
(Update Dec 2025) Prism Academy has been merged into our new Resources Center, which guides you through your research workflow - from data import through publication. It features expert-led video tutorials and step-by-step guides that help you:
- Organize and analyze your data
- Master choosing the right analyses, interpreting results whilst avoiding common statistical pitfalls
- Create publication-ready graphs that clearly visualize your findings
- Collaborate smoothly with your team through Prism Cloud
- Use GraphPad's online Sample Size Calculator to plan robust experiments

Explore all of the analyses Prism has to offer
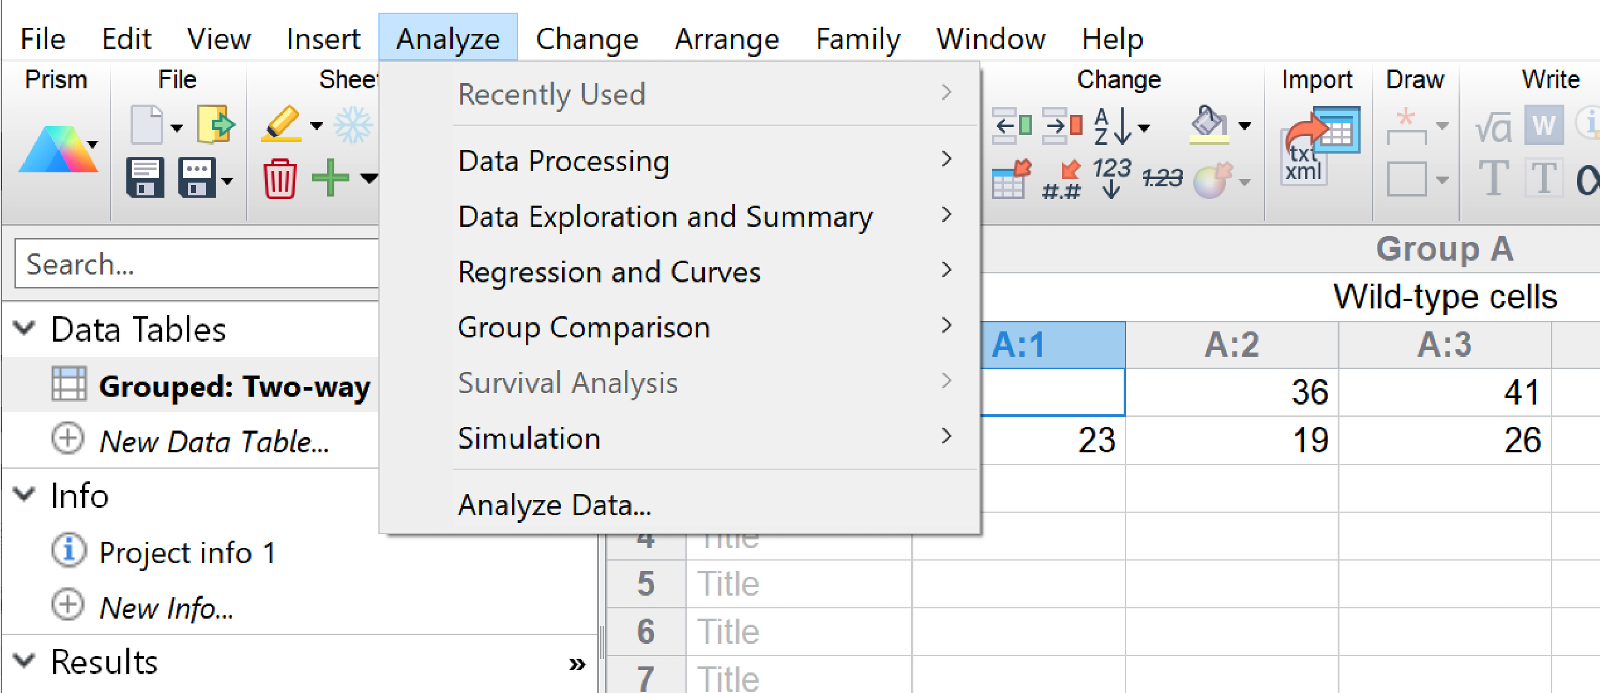
Prism 9.1.0 introduces the all new Analyze menu. Prism's analysis library has been organized into six primary categories allowing you to more easily find the analysis that you need. These analysis categories are:
- Data Processing
- Data Exploration and Summary
- Regression and Curves
- Group Comparison
- Survival Analysis
- Simulation
Additionally, this menu includes a list of the seven most recently used analyses for quick access to tests that you perform regularly. Using this menu, you can also quickly access the full Analyze Data dialog (which also allows for specific data sets to be included/excluded from the analysis).
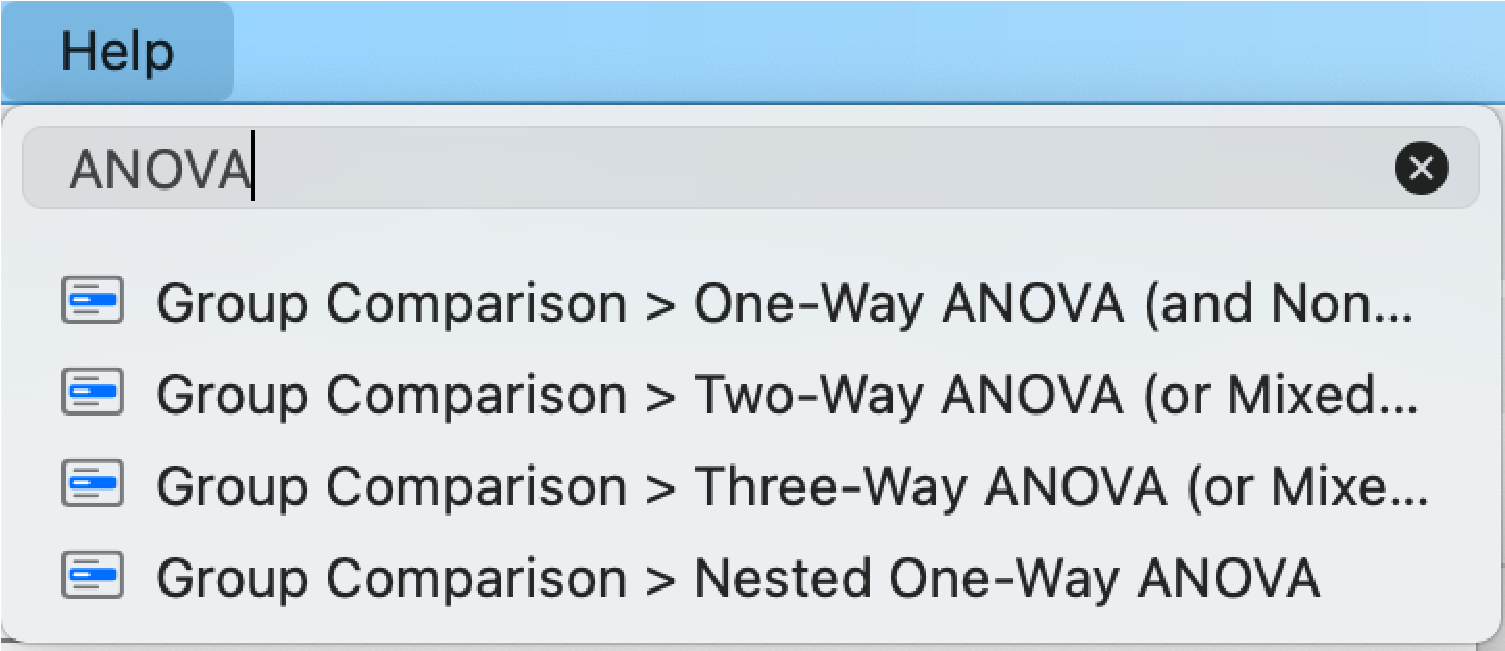
Finally, for Mac users this list is fully searchable! Simply open the Help menu and start typing the name of an analysis and all of the matching analyses will be displayed for you!

More PCA Improvements
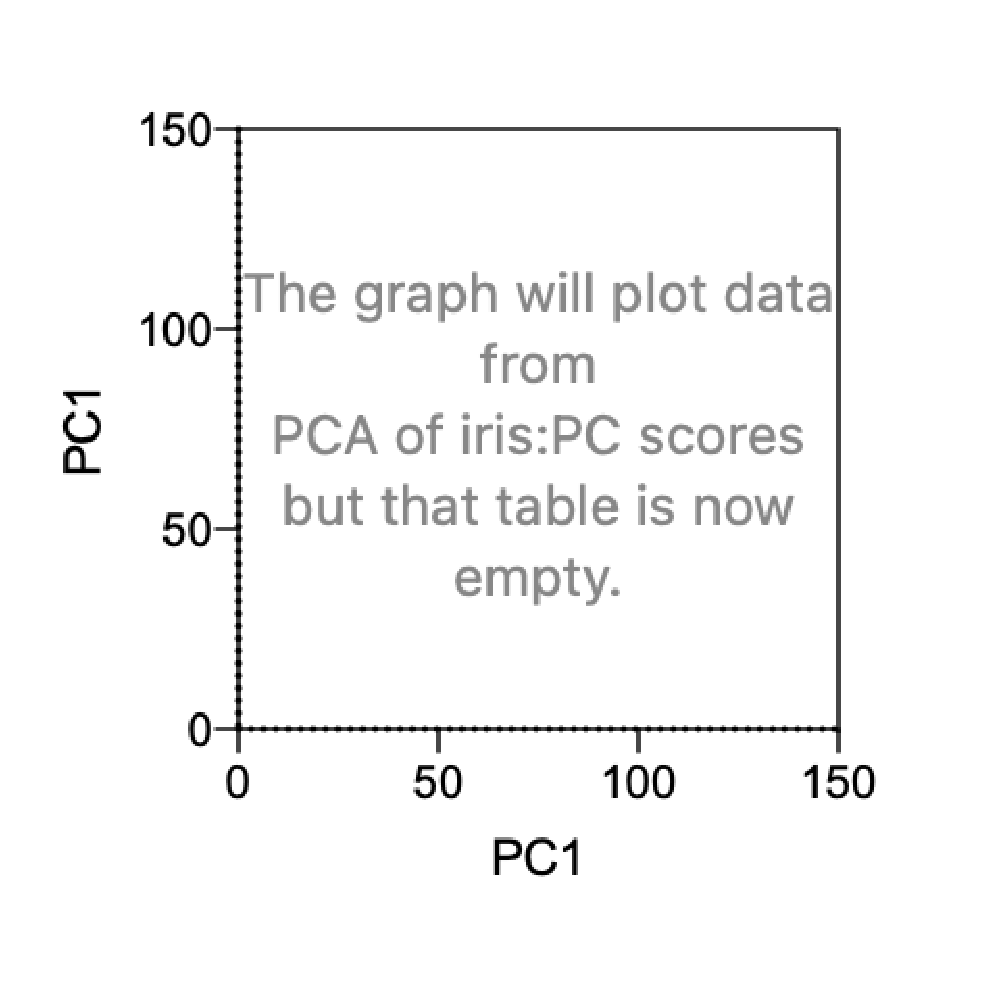
The primary objective of Principal Component Analysis (PCA) is dimensionality reduction, so it shouldn't be too surprising that the results of PCA include fewer selected principal components than the number of variables that went into the analysis. However, what may have been somewhat surprising was the graphs that Prism generated when only a single PC was selected during the analysis. When this happened, Prism wasn't able to generate any sensible results on the Loadings Plot, Score Plot, or Biplot graph sheets.

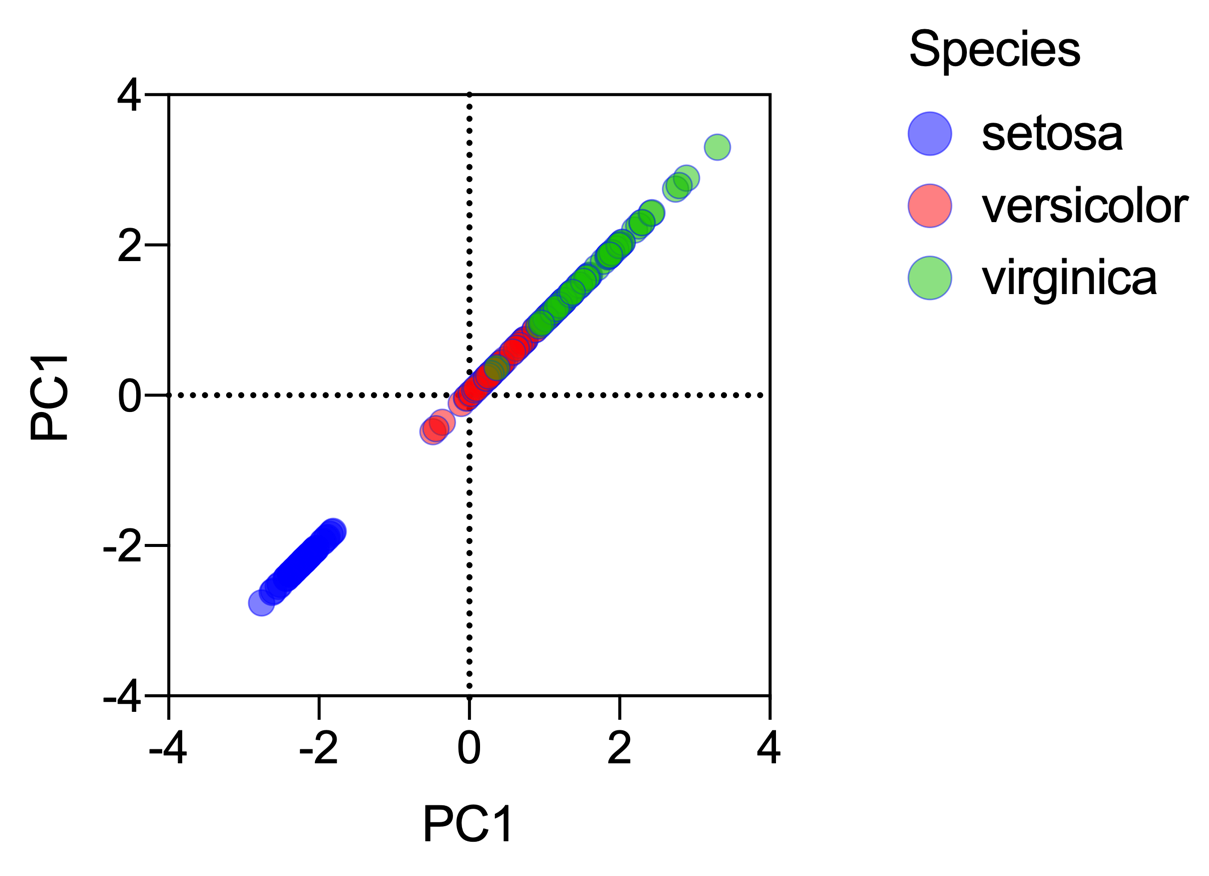
But don't worry: nothing went wrong with the analysis. In fact, if you used one of the automatic methods for PC selection (such as Parallel Analysis), results indicating that only a single PC was selected may be extremely informative! In Prism 9.1.0, we updated the graphical output in these scenarios to accurately reflect these results.

The same PC is used on both the X and Y axis, so the data will lie along a straight diagonal line. However, the same information is available (are there any visible grouping patterns on the scores plot, what relationships are there in the original variables displayed on the loadings plot, etc.).
Complete release notes for Prism 9.1.0
New Features
- Prism Academy integration with three methods of access
- Welcome dialog menu panel button
- Toolbar Help section button
- Help menu item
- New Analyze main menu (searchable on macOS using the system search function)
- Principal Component Analysis graphs with a single selected principal component (same component on both axes)
- Incorporated the "Do not show this message again" checkbox to numerous alerts throughout the software
- Added an option in the Prism preferences (View tab) to re-enable all suppressed alerts
Feature Improvements
- Prism now automatically plots the upper and lower 95% limits of agreement when graphing Bland-Altman analysis results
- Added the checkbox "Do not show in legend" for the "Other values" option in the "Format Graph" dialog for heat maps allowing the "Other values" section of the graph legend to be turned on or off
- Made it possible to delete all sheets from the Navigator using the "Delete" key
- Added a button to the About Prism dialog allowing the version, serial number, and machineID to be copied
- Renamed the checkbox title in Prism's preferences from "Show graph hints about missing error bar, etc" to "Show graph warnings (gray notes)"
- Improved the behavior of the "Analyze" toolbar button when multiple sheets are selected (in the Gallery or in the Navigator)
- (Win) Improved the auto-recovery feature so that Prism does not crash on opening corrupted files where data set references in tables were broken
Analysis Bugs Fixed
- Fixed the feature to change the direction of the differences on "Volcano plot" results via the "Report differences as" option in the "Options" tab of the "Parameters: Multiple t test" dialog
- Fixed the issue in which Prism would crash when attempting to perform an analysis using a user-defined equation that included several IF functions for a single variable
- Fixed the mismatch of the Y-intercept parameter between the results table and the Hook Constants dialog for the Deming (Model II) linear regression analysis
- Fixed the issue in which the "Paired Multiple t test" results were unexpectedly altered after adding or removing data sets with values that were all excluded
- Fixed the issue in which the "Select and transform" results appeared empty after performing an analysis if the source data table contained several hundreds of data sets
- Fixed the issue in which Multiple logistic and Poisson regression reported incorrect VIF results if the model did not include an intercept term
- Fixed the issue in which the alert "Multiple t tests (and nonparametric) requires two data sets (groups). To compare just two, select those two from the groups in the Analyze Data dialog." did not appear
- Fixed the issue in which Prism would crash when attempting to perform Multiple linear regression with thousands of interactions without an intercept term
- Fixed the issue in which newly added variables did not appear in the "Select and transform" results sheet if different variables were previously deleted in the source data table
- Fixed the issue in which the X column was unexpectedly empty in "Transform" results sheets if the source data table contained X values as a series and the last data set contained only a column title without data
- Fixed the issue in which Prism would freeze when attempting to perform the "Chi-square" analysis with the "Odds ratio" effect size using the Baptista-Pike method
- (Win) Fixed the issue in which no alert appeared when attempting to open the "Parameters: Multiple t tests" dialog while three or more data sets were selected in the "Create New Analysis" dialog
- (Mac) Fixed the issue in which Prism would occasionally crash when performing the "Multiple t test" analysis for the same data table with different data sets
- (Mac) Fixed the issue in which the wrong options were present in the "Replicates" section of the parameters dialog for Nonlinear regression analysis performed on a data table with a single Y column
Graphing Bugs Fixed
- Fixed the issue in which comparison lines did not appear on Violin graphs if violins were clipped and the source data table contained replicate values
- Fixed the issue in which comparison lines did not appear on a graph if any error bar was clipped
- Fixed the alignment of additional and default ticks on the X axis
- (Win) Fixed the issue in which axis titles did not move after changing their distances from the respective axis using the options in the "Format Axes" dialog
- (Win) Fixed the issue in which transparency was not applied to graphs (except for bubble plots) after applying semi-transparent color schemes
- (Win) Fixed the issue in which it was impossible to select the Size legend of a bubble plot if the "One size for entire graph" radio button was previously selected in the "Format Graph" dialog and the "Undo" operation was performed
- (Win) Fixed the issue with the corruption of "Scientific" and "Power of 10" formats chosen for numbers/labels for the "Fill Color" legend on a graph
- (Win) Fixed the issue in which unexpected points on a graph would appear after a logarithmic transform was performed on an X column containing negative or zero value(s)
- (Win) Fixed the issue in which minor ticks did not appear on an axis of a multiple variables graph after resizing the axis by stretching
- (Win) Fixed the issue in which axis titles unexpectedly appeared on the graph's plotting area after setting the origin to the right or upper sides
- (Mac) [macOS 11 Big Sur] Fixed the issue in which the Style dropdown was corrupted while horizontal lines were selected for error bars in the "Format Graph" dialog of XY and Survival graphs
- (Mac) Fixed the issue in which all values appeared with a single color (black) when applying a categorical variable to the "Fill Color" plot from the Format Graph dialog of a Bubble Plot
- (Mac) Fixed the "Magic" feature that did not apply the "Legend" option for graphs other than multiple variables graphs
- (Mac) Fixed the issue in which the positions of legends were not saved in a Prism file after moving them using the keyboard
- (Mac) Fixed the issue in which is was impossible to apply quartiles pattern in the Format Graph dialog for a violin graph on Mac devices with an Apple M1 chip
Other Bug Fixes
- (Win) Fixed the issue in which Prism would crash upon deleting all but one graph or layout from the gallery view
- (Win) Fixed the issue in which it was impossible to copy to Prism fractional data starting with a comma (used as a thousands separator)
- (Mac) Fixed the issue in which Prism would crash upon applying a negative value for an additional tick after changing axis Gaps and Direction settings
- (Mac) Fixed the issue in which an incorrect value was displayed in the "Variable" drop down menu for connecting lines in the "Format Graph" dialog for Bubble plots after the variable was deleted/excluded/changed in the source data table
- (Mac) Fixed the issue in which Prism would crash upon unfreezing a bubble plot graph sheet after an attempt to flip the page via the toolbar button if the project had previously been saved and re-opened
- (Mac) Fixed the issue in which a graph was being linked to a newly created data table after deleting the original source multiple variables data table and creating a new one instead
- (Mac) Fixed the issue in which Prism would crash after clicking on the Cancel button in the "Change Graph Type" dialog invoked for an empty PCA graph
- (Mac) Fixed the issue in which asterisks were lost upon pasting data copied from multiple cells containing values starting/ending with an asterisk in the multiple variables data table
- (Mac) Fixed the issue in which Prism would crash when a file contained chained analyses including Nonlinear regression
- (Mac) Fixed the issue in which no alert would appear when attempting to delete the example graph from the "Magic Step 1" dialog
- (Mac) Fixed the issue in which some of the analysis buttons were unexpectedly available on the toolbar for multiple selected sheets
- (Mac) Fixed the issue in which Prism would crash upon switching to the residual graph created from a Multiple linear regression analysis if an additional row of data was previously added in the source data table with 1024 data sets
- (Mac) Changed the wording to "How to decide when an effect is convincing enough to investigate further" in the "Multiple Comparisons" tab of the "Parameters: Multiple t tests" dialog
- (Mac) Fixed the issue in which Prism would crash when performing the redo command to merge a project that includes a multiple variables graph
- (Mac) Improved the wording of the alert that appeared on an attempt to perform the Multiple t tests analysis with three or more data sets
- (Mac) [macOS 11 Big Sur] Fixed the issue with the truncated hint in the "Experimental Design" tab of the "Multiple t tests" analysis parameters dialog
- (Mac) Fixed the issue in which Prism would crash upon switching to the Multiple linear or logistic regression analysis results when the analysis was performed without an intercept term or main effects after removing or excluding entire variable values from the source data table
Analyze, graph and present your scientific work easily with GraphPad Prism. No coding required.
