Explore the Scientific R&D Platform

An open portfolio of interoperable, industry leading products

The Dotmatics digital science platform provides the first true end-to-end solution for scientific R&D, combining an enterprise data platform with the most widely used applications for data analysis, biologics, flow cytometry, chemicals innovation, and more.

Explore the Platform

Flow Cytometry

Learn how Prism can help with flow cytometry data analysis: from importing to visualizing and sharing.

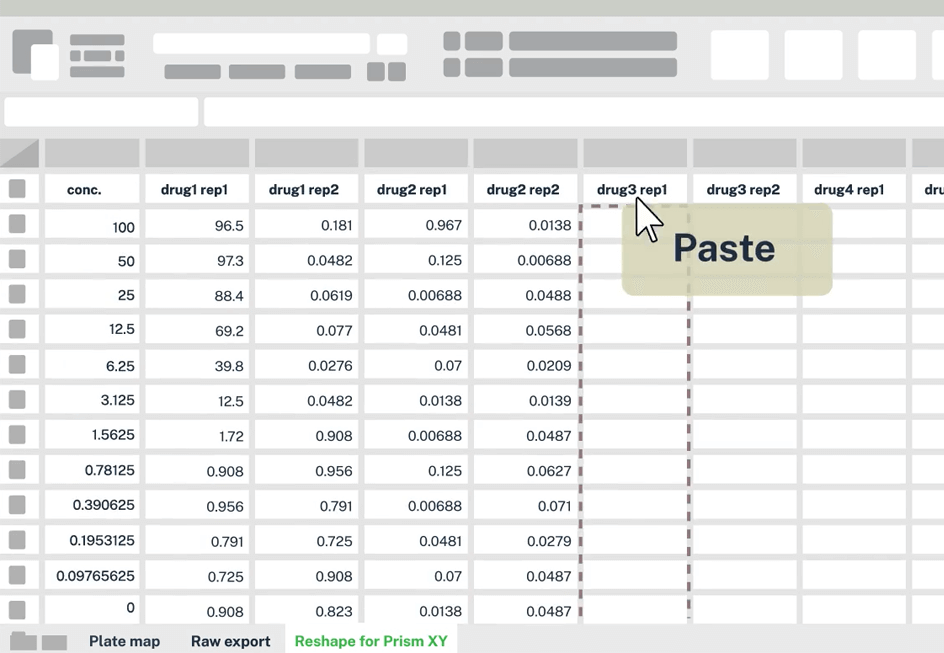
Easily import flow cytometry data into Prism

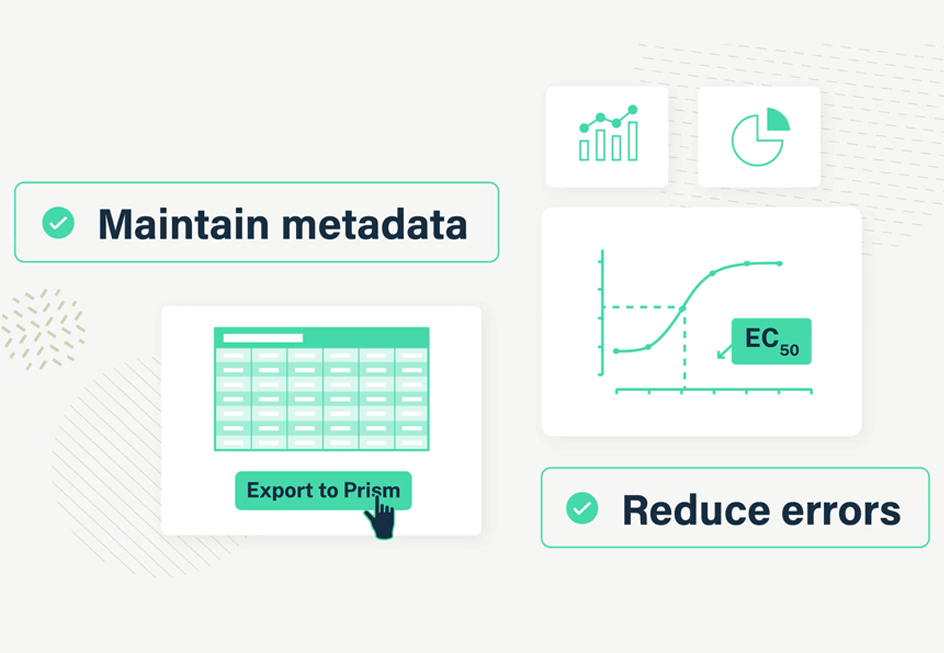
Save valuable time and reduce errors associated with manual data manipulation

Prism Flow Cytometry Integrations

Eliminate manual data manipulation and reduce the potential for errors. Export your FCS data from OMIQ and FCS Express as Prism files. Open in Prism to enjoy effortless data import and seamless statistical analysis and visualization.

Avoid manual manipulation created by FlowJo

Although you can still manually copy, paste and reformat your data for analysis in Prism, transitioning to OMIQ or FCS Express can significantly enhance your flow cytometry workflow and minimize manual errors.
See why Prism users are switching from FlowJo.

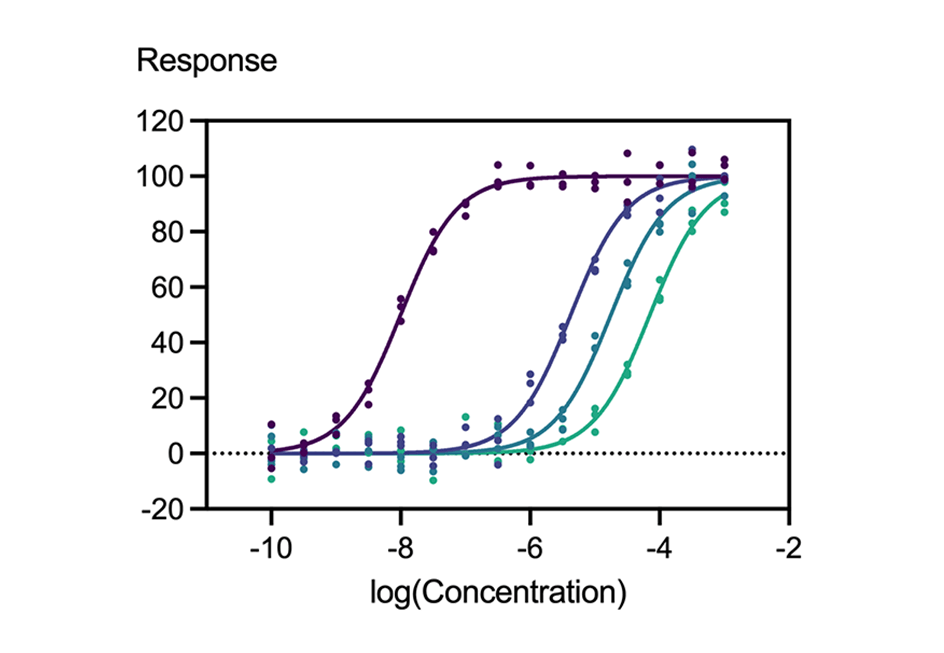
Transform complex flow data into compelling visuals

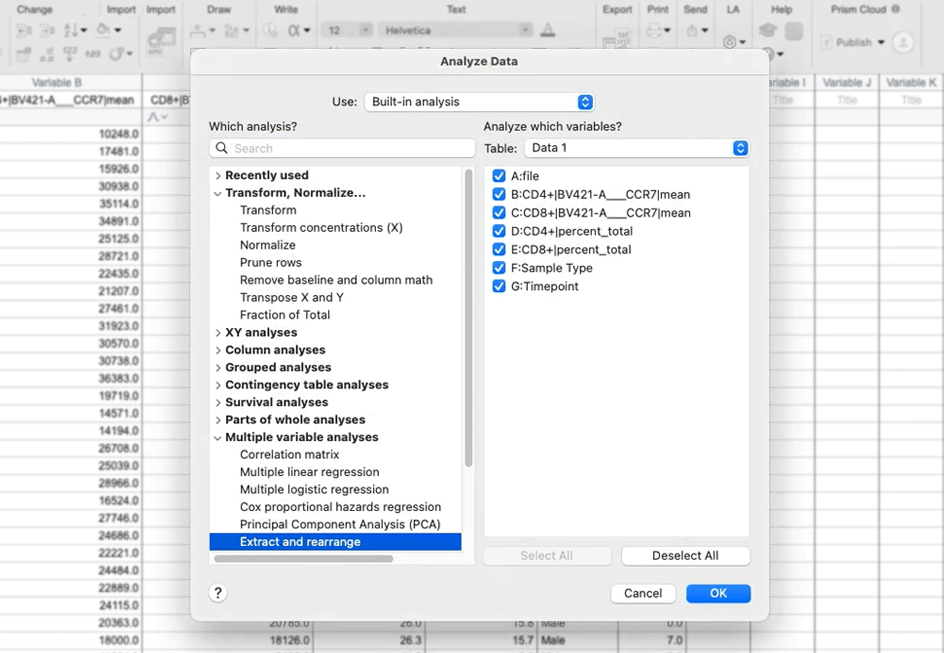
Streamline the steps required to analyze and visualize your flow cytometry data

Simplified flow cytometry analysis

Save valuable time and avoid errors associated with manual data manipulation. Export your FCS data from OMIQ or FCS Express as a Prism file.

Prism's data tables are designed to facilitate easy analysis of your flow cytometry results. Effortlessly extract and reorganize data, perform t-tests, ANOVA, nonparametric tests, correlation analysis, and more to validate your findings and make well-informed decisions.

Explore variable relationships and fit nonlinear models

Understanding the effect of your independent variable on your dependent variable is essential for many flow cytometry analyses.
Visualize these relationships using Prism’s XY graphs, and see - for example - the effect of drug or inhibitor concentration on biomarker expression. Derive insights from your data by quantifying these relationships through various analyses including correlation, regression, trendline analysis, and nonlinear regression (EC50/IC50).

Compare Across Single or Multiple Groups

Prism's Grouped and Column Graphs simplify flow cytometry analysis, guiding you to identify trends and patterns in your data.
Grouped Graphs are ideal for processes such as comparing marker distributions among different cell populations, while Column Graphs are favorites for visualizing and comparing categorical, such as treatment groups or experimental conditions.
Perform statistical tests in Prism, such as t-tests, one-way ANOVA, and two-way ANOVA, to assess the significance of your findings and draw meaningful conclusions.

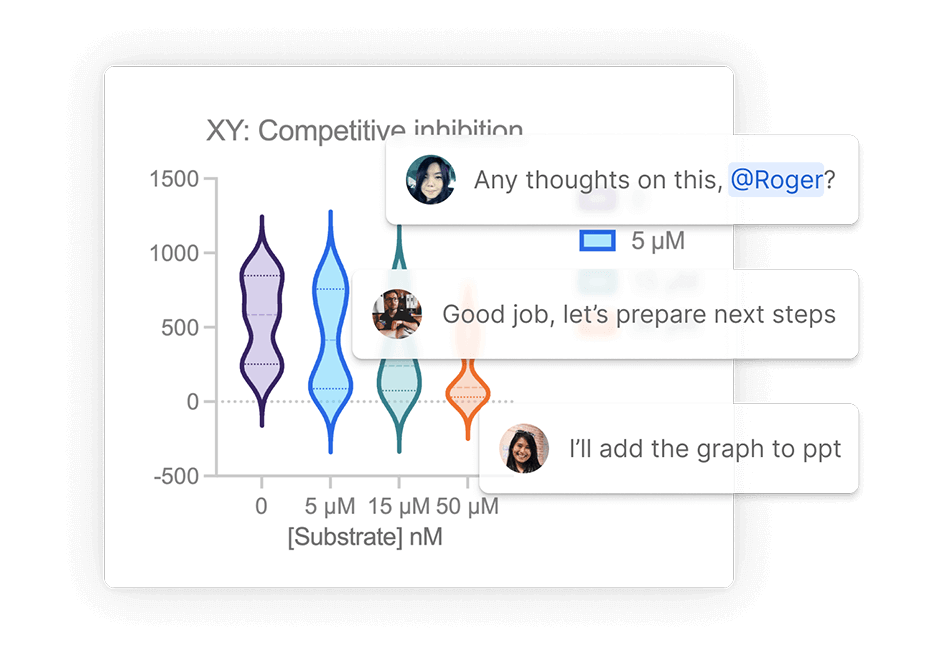
Share Visualizations

Prism Cloud is the fastest way to share, view and discuss your Prism projects with your peers

Prism Cloud

Easily publish your Prism projects to Prism Cloud straight from the desktop app and start collaborating to prepare your project for submission to scientific journals or internal reviews.

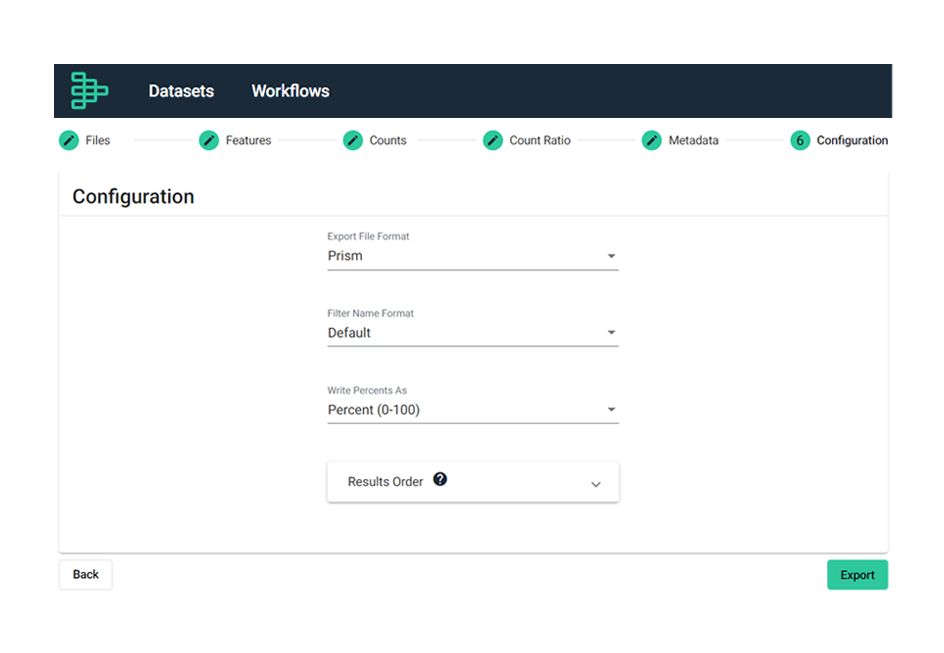
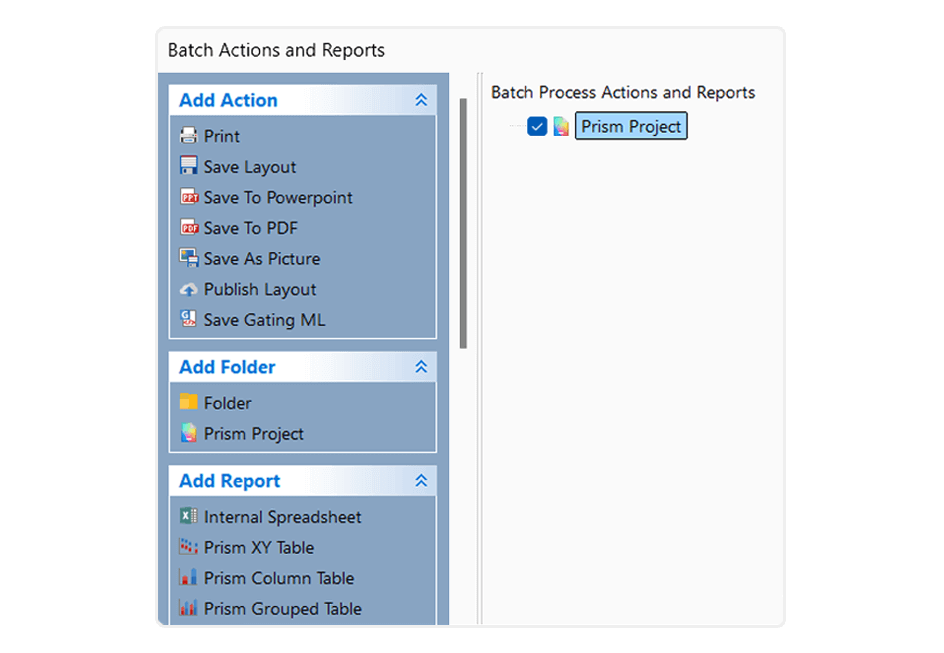
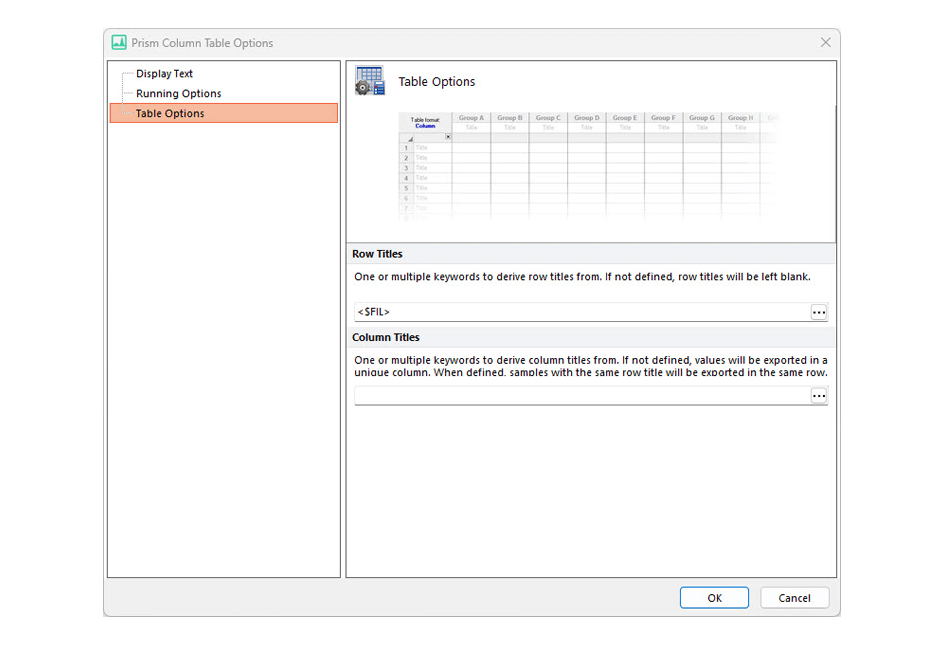
Integrating OMIQ & FCS Express with Prism

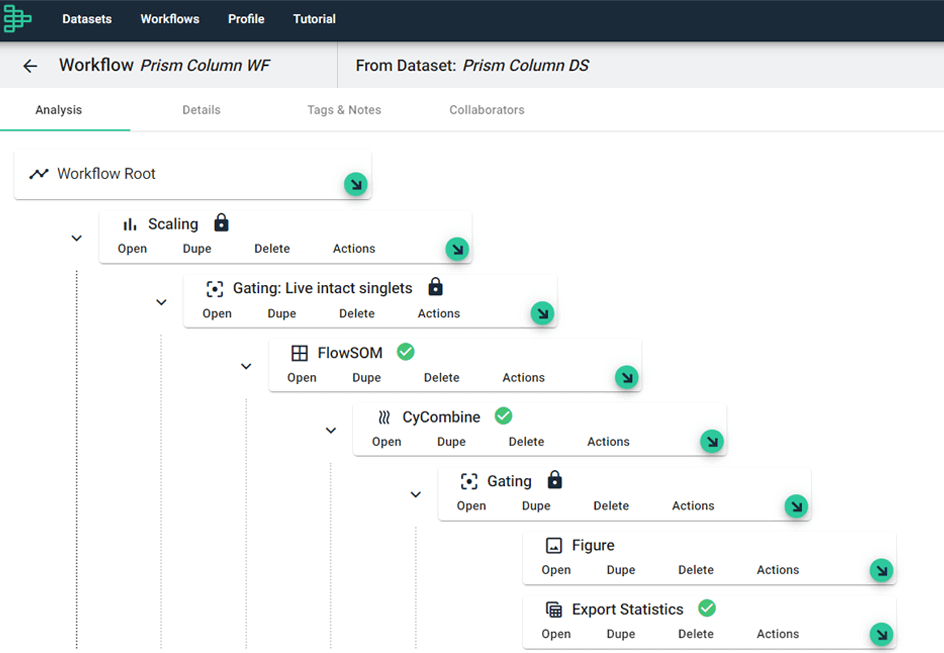
Automate and standardize complex flow cytometry analyses to smoothly create clear, publication-ready graphs

OMIQ and Prism Integration

  • Export FCS data from OMIQ as a Prism file
  • Quickly open a multiple variable table
  • In just a few clicks create XY, Column, Grouped Tables, and related statistical analysis, with accompanying graphs
  • Use Prism Cloud to share visualizations and results

Exporting from OMIQ to Prism

  • Use a template or build a custom workflow in OMIQ
  • Choose any additional statistics you want to export
  • Open your OMIQ data in Prism!

FCS Express and Prism Integration Prism

  • Export FCS data from FCS Express as a Prism file
  • Quickly open XY Table, Column Table & Grouped Table
  • Use Prism Cloud to share visualizations and results

Exporting from FCS Express to Prism

  • Go to the Batch tab and open batch actions
  • Select your tables and choose how to organize the data
  • Choose the statistics to export and run
  • Open your FCS Express data in Prism!

Flow Cytometry Highlights in Prism

Key Benefits of Prism's Flow Cytometry Integration
  • Export FCS data from OMIQ and FCS Express as Prism files
  • Eliminate manual data manipulation, reducing errors and saving time
  • Transform complex flow data into clear, compelling visuals
  • Quickly perform statistical tests, such as t-tests, ANOVA, and correlation analysis
  • Use Prism Cloud to easily share, view and discuss your Prism projects

Prism simplifies the analysis of flow cytometry data. By integrating with top flow cytometry software like OMIQ and FCS Express, you can export your FCS data as a Prism file, saving valuable time and avoiding the errors associated with manual data manipulation.

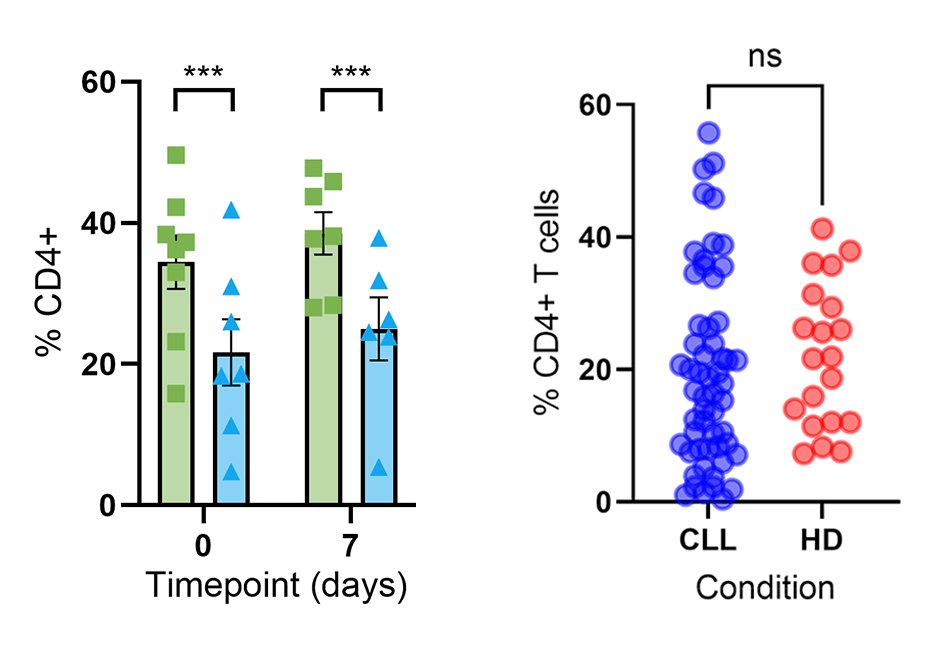
Whether you're comparing cell populations, analyzing marker expression, or monitoring changes over time, effortlessly display your data as XY, grouped, and column graphs. Analyze and create clear, publication-ready visualizations that accurately reflect your findings.

Analyze, graph and present your scientific work easily with GraphPad Prism. No coding required.