
The Standard Addition Method for determing concentrations.
Prism can easily interpolate from a linear or nonlinear standard curve. You perform the assay at a number of known concentrations, fit a line or curve, and interpolate the uknown values.
But there is a problem with interpolating from a standard curve. The results can be incorrect when the unknown sample are contaminated with other substances that alter the assay. This is known as the 'matrix effect problem'.
The Standard Addition Method is a way to bypass this problem. You don't need to perform the assay with known concentrations of substance. Instead you add various known concentrations (including zero) of known substance to a constant amount of the unknown. This ensures that all the samples have the same amount of unknown, including any substances that interfere with the assay.
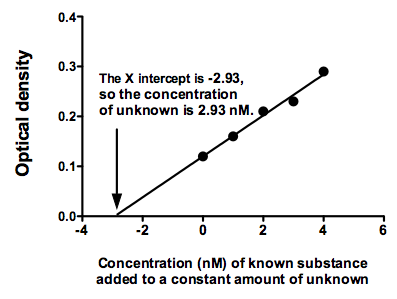
Fit the data with linear regression. The value you want to know is how much of the known substance has to be added to double the signal. There is an easier, somewhat trickier, way to find out: Extrapolate the line down to Y=0. One of the parameters that Prism reports is the X intercept, which will be negative. Take the absolute value, and that is the concentration of the unknown substance. The confidence inerval for the X intercept gives you the confidence interval for the concentration of the uknown. Simply multiply both confidence limits by -1.
To plot the data in Prism, you'll want to extend the linear regression line to start at an X value equal to the X intercept (a choice in the Linear regression parameters dialog). You may also want to move the origin to the lower left, a choice on the first tab of the Format Axis dialog. Here is a graph created with this Prism file.
Keywords: SAM