
I want to create a Column Graph with different positive and negative standard error bars (calculated elsewhere).
With Prism 3 or 4: Format the data table for no X column, and a Y column formatted for mean, -error and +error. This is a choice along wtih direct entry of SD, SEM, etc. Enter your data on one row, entering the mean, the distance to the bottom of the lower error bar and the distance to the top of the upper errorbar. Note that you are entering the length of each error bar, not the Y coordinate of the end of the bar.

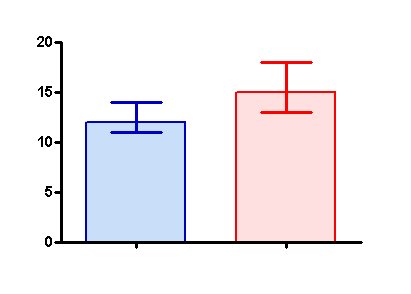
Reformat the graph to be a column bar graph, with error bars going up and down, and with no fill pattern or an opaque fill (so you can see the bar going both directions).
Alternative method for Prism 4: Create a table with single column of Y values. Enter the data on three rows for the mean, value of the top error bar, value of the bottom error bar. In the Format Columns dialog choose to plot median and range of the error bar.
Keywords: line, bar, graphing