
How to back calculate a calibration curve with Prism.
GraphPad Prism makes it easy to fit a line or curve to your data, and then to interpolate unknowns from the curve. See how.
Some investigators want to back calculate from that curve (or line). What this means is to interpolate each of the Y values which the model was fit to to find out what X value they correspond to. Then the goal is to compare those interpolated (back calculated) X values with the actual X values. When it "interpolates" an X value from a standard curve, Prism finds the X value corresponding to the entered Y value on the best-fit curve. The line or curve doesn't go exactly through every experimentally measured point, so the interpolated X value for a Y value won't exactly match the observed X value for that Y. Some find it helpful to look at the patterns of how the actual X values differ from the back calculated X values. Prism does not do this automatically, but use these steps to get the job done.
- Enter the X and Y values for the standard curve.
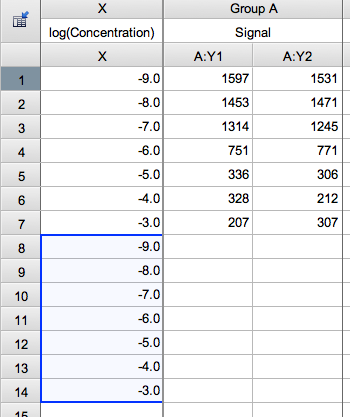
- If you want to back calculate Y values from entered X values: Select and copy the X values, and paste them lower on the table. If using Prism 6 or later, use Paste link so these pasted values will update if you edit or replace the original X values. When you paste link, the pasted values are surrounded by a blue box. Note that these rows will have only X values and no Y values. (See left screenshot below.)
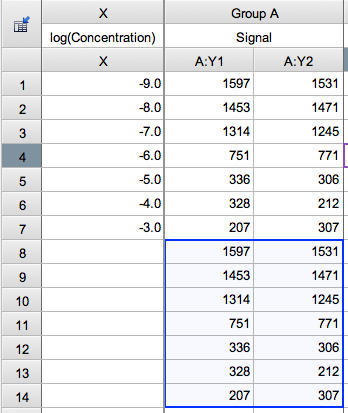
If you want to back calculate X values from entered Y values. Select and copy the Y values, and paste them lower on the table. If using Prism 6 or later, use Paste link so these pasted values will update if you edit or replace the original Y values. When you paste link, the pasted values are surrounded by a blue box. Note that these rows will have only Y values and no X values. (See right screenshot below.)
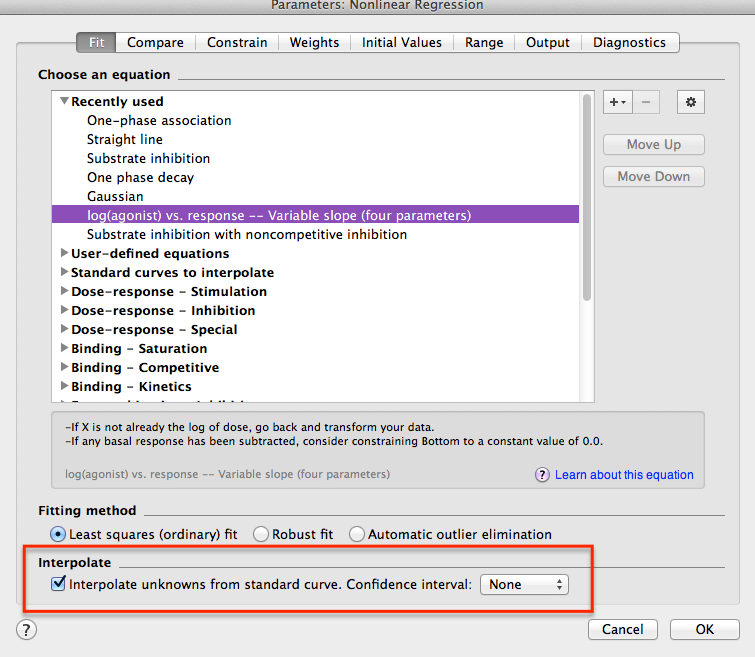
- Choose nonlinear (or linear) regression and choose the option to interpolate from a standard cuve.
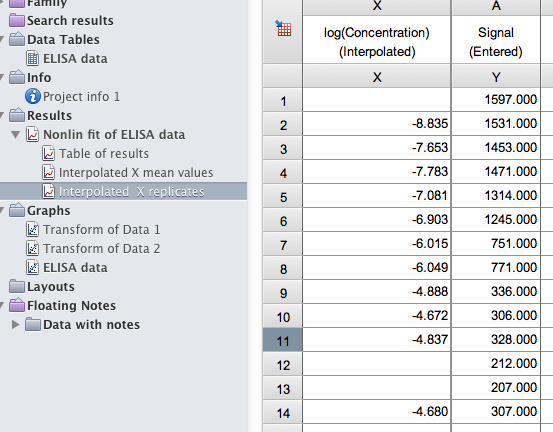
- Find the results page with the interpolated (back calculated) results.
Why are some interpolated values blank? - Analyze or graph those back calculated values as you see fit.


Keywords: back-fit backfit back-solve backsolve solve interpolate interpolation extrapolate extrapolation unknown unknowns