
How To Use Power Analysis To Determine The Appropriate Sample Size Of A Study
When designing a research study, one of the most important considerations is determining the appropriate sample size. The desired sample size for a study affects many logistical considerations for research, such as cost projections, resource allocations, and timeframe requirements. Of equal importance, however, is that sample size plays a critical role in the inherent ability of a study to detect differences between groups. Power analysis explores the mathematical relationship among several variables involved in study design to inform researchers about its potential to draw meaningful conclusions after data analysis. Its primary use is as a tool to be used during study design to determine and justify the appropriateness of a proposed sample size.
Hypothesis Testing and Types of Error
Hypothesis testing refers to the fundamental process of evaluating whether data from one group is either consistent with the null hypothesis (H0) or consistent with an alternative hypothesis (H1). This experimental determination will either accurately reflect reality or lead to an erroneous conclusion that does not reflect real life. There are two different ways in which an error can be made during hypothesis testing, referred to as Type I error (denoted by α) or Type II error (denoted by β). The chart below summarizes the four scenarios that are possible comparing experimental results (listed on top) with reality (listed on the left):

Type I error is the likelihood that the null hypothesis is rejected but should not be. This can also be defined as the likelihood of a false positive result, or the likelihood that an effect is detected when one is not truly present. Type I error is concerning because it can wrongfully promote the effectiveness of medications or other interventions when it is unwarranted, and therefore α values are conventionally chosen to be low, usually at 0.05.
Type II error is the likelihood that the null hypothesis is not rejected but should be. This can also be defined as the likelihood for a false negative result, or the likelihood that no effect is detected experimentally when an effect actually exists. Traditionally, this type of error has not been considered as problematic as Type I error and is often allowed to be higher, usually chosen to be 0.20.
The Definition of Power
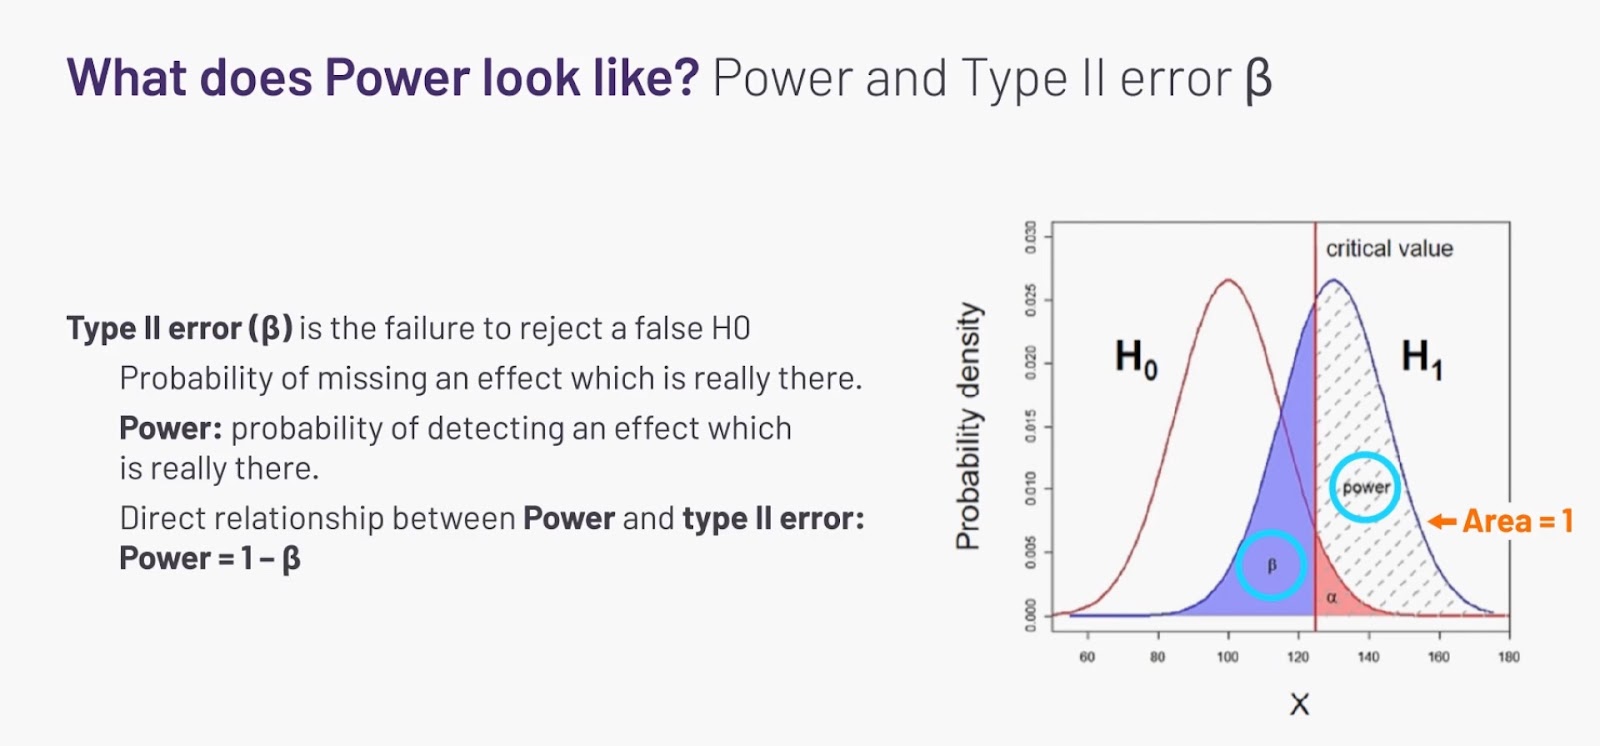
Power is defined as the probability that a statistical test will reject a false null hypothesis (H0). This can also be stated simply as the likelihood that a study will detect an effect, given that the effect is really there. Power is directly related to Type II error (β), as the following graphical representation of hypothesis testing demonstrates. If the area under each hypothesis curve is 1, then power is expressed mathematically as 1- β.
Learn more about calculating sample size with power analysis from Dr. Anne Segonds-Pichon, Bio-Statistician at the Babraham Institute.
Critical Values and Hypothesis Testing
The larger a study sample size, the more power the study will have to detect an effect. The relationship between sample size and a study’s ability to reach significant results can be understood by exploring the role of critical values in hypothesis testing. Statistical tests produce a test statistic specific for the kind of data being analyzed. For instance, a Student’s t test for continuous variables will calculate a t value. This test statistic must be compared to a critical value to determine if the test statistic reaches the desired p value for significance. Critical values are calculated by an equation that includes the chosen p value and the sample size (mathematically represented as degrees of freedom in the equation).
Once a critical value is determined, data can be evaluated as showing a significant result if its test statistic exceeds this critical value. To illustrate this, the chart below shows a continuum of data possibilities in which the difference in group means becomes further and further apart. At a certain point, this difference in means becomes large enough that the t value exceeds the critical value. From this point onward, the difference is considered significant.

Power Analysis to Determine Sample Size
The main output of a power analysis is to estimate the appropriate sample size for a study. Power analysis accomplishes this by examining the relationship among six variables:
-
Difference of biological or scientific interest
-
Expected variability in the data (standard deviation of the data)
Effect Size of Interest
-
Power of the study (1 - β)
-
Significance level (α)
-
Sample size
-
Directionality of the effect being examined (one-sided or two-sided test)
In the process of designing a study, power analysis is used to calculate the appropriate sample size by assigning values to the other 5 variables in this relationship.
The effect size of interest is determined by considering the first two of these variables together. When designing a study, the difference of biological or scientific interest is a fundamental research question, not a statistical question. This must be decided based on scientific knowledge and previous studies. The second component in establishing the effect size to be evaluated involves the degree of variability in the data. Since study design precedes actual data collection, the expected variability in the data is necessarily a prediction that must be based on previous research or pilot studies. Taken together, the combination of the difference of biological interest and the expected variability in the data comprises the effect size that a study is focused on evaluating. It is not generally recommended to choose standard effect sizes based purely on calculations of standard deviation. The effect size of interest should be motivated purely by the scientific context of the study.
The desired power of a study affects the necessary sample size because as sample size increases, the mean of the observed values will more closely represent the true mean in the population. Increased power causes a lower Type II error likelihood. Type II error has not traditionally been considered as problematic as Type I error, so β values are often tolerated to be about four times greater than α values.
Conventional practice is to set power at 80%, allowing for a 20% likeliness of Type II error. Incidentally, this convention is somewhat arbitrary and stems from the work of Jacob Cohen, the author of an influential manuscript on power written in 1988. This standard is starting to be scrutinized more carefully, as a study with a power of 80% still has a one in five chance of being unable to detect a true effect that exists. It may be reasonable to desire the power of a study to be 90% or even 95%, but the effect of this increase on sample size must be weighed carefully. There are a few additional strategies to increase the power of a study that should also be considered.
The significance level for a study refers to the amount of Type I error (α) deemed acceptable. This is almost always set to 0.05, the conventional threshold for p values to be deemed significant. A result is therefore considered significant if there is less than a 5% likelihood that the null hypothesis will be rejected due to chance alone. Each statistical test will have a unique critical value that corresponds to reaching this level of significance for a given set of data, as previously discussed.
The final variable that will determine the appropriate sample size for a study is the directionality of the alternative hypothesis. Critical values differ depending on whether an analysis looks for a difference in either direction (bi-directional, or two-sided) or strictly looks for a difference in one direction (uni-directional, or one-sided). In the example of a Student’s t test for analyzing continuous data, the chart below reflects how critical values depend on whether a one-tailed or two-tailed t test is used.

The general convention among scientists has been to apply two-sided tests to look for bi-directional differences, even though this will have a higher threshold to reach significance (a higher critical value). While it may be beneficial to restrict some study designs to one-sided analysis, this may limit the ability to compare such studies with analogous two-sided studies.
Power Analysis to Evaluate Completed Studies
A secondary use of power analysis is to help interpret studies with results that are not significant. Studies that fail to show a significant effect—frequently called negative studies—are only meaningful if such studies had adequate power to detect the effects they intended to measure. To use a power analysis in this way, the sample size is already a known quantity and can be considered along with the α value and the effect size to calculate the power of the study. If a study has low power to detect a meaningful effect size, the negative study is less useful. As power approaches 50%, a study would have an equal chance of detecting an actual effect or missing it.
An important caveat to this process is that power analysis should not be used retrospectively to modify a study design after data has already been collected. Such an attempt to increase power by increasing a sample size after results have been analyzed is rarely justified and is referred to as post-hoc power analysis.
In summary, power analysis is a critical step during study design to determine appropriate sample size. It requires careful determination of the effect size that is of biological or scientific interest before a calculation can be made. In addition, researchers must specify a desired power and significance threshold for the study and decide about directionality of the statistical tests before an appropriate sample size can be calculated.
Keywords: power analysis sample size calculation, type II error