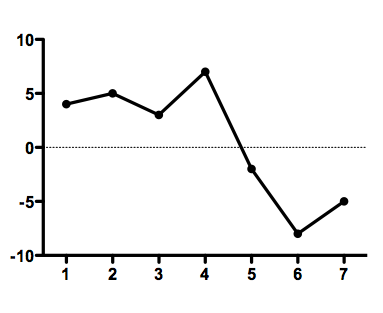
Graph tip - When my X axis crosses Y at a point other than 0, why is there is an extra line at Y=0?
When the Y axis starts at a negative value and ends at a positive value, Prism adds a line at Y=0. it is easy to remove. How to do so depends on which kind of graph you made:
XY graphs

On an XY or column graph, when the Y axis spans zero, Prism automatically places a grid line at Y=0. This is easy to remove. Double click on the axis, to bring up Format Axis dialog. At the bottom, you'll see that Prism is configured to plot a grid line at Y=0. Uncheck that option, and the line goes away.

Prism 5.00 also added an automatic grid line at X=0, but we removed that from the current release. The Y=0 line seems to be useful/desired more often than not, so we have kept that in.
Grouped graphs
With grouped graphs the line at X=0 is not created by the additional ticks and grids function. It represents the baseline on the graph. For a grouped column graph this makes sense.

For a grouped scatter plot you may want to hide the baseline.

To get rid of the line at X=0, double-click on any column on your graph to open the Format Graph dialog and go the the Graph Settings tab. Instead of having Prism set the baseline automatically. tell Prism where you want the baseline to be and whether or not to show the baseline.

If you choose Hide Baseline, the line at X=0 will go away.

Keywords: axis line, second axis, zero line, dotted line, baseline, base line, X=0


