
Creating a depth chart
A depth chart is an XY plot rotated so the independent X variable is shown on the vertical axis, and the dependent Y variable is shown on the horizontal axis. This makes sense when the X variable is depth, so depth charts are used in geology, oceanography, etc.
Creating the graph
Create an XY graph. Then use the Format Axis dialog to change the direction of the numbering on both axes.
Delete the automatic X axis title. Instead, create an independent text object which you can rotate 180 degrees.
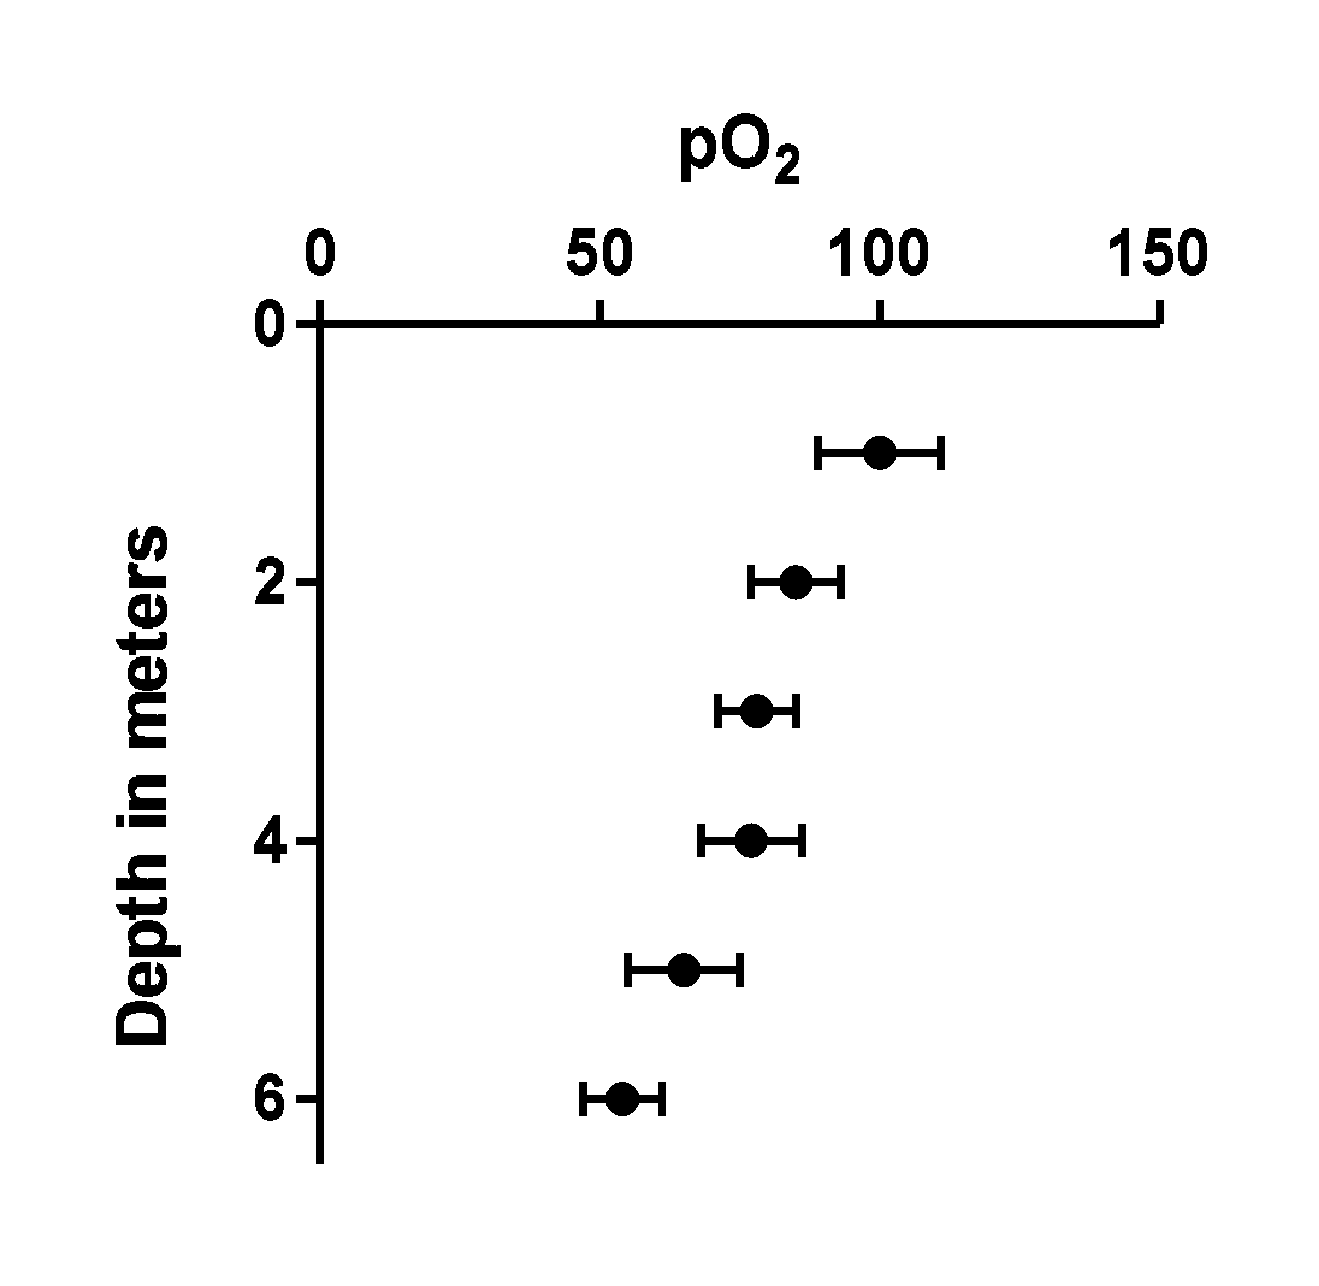
Your graph, in Prism's graph section, will look like this:
.png)
Rotating the graph onto the layout (Prism 6)
When you assign this graph to a layout using Prism 6 (but not earlier versions), you can rotate it 90 degrees.

The result, on the layout, is the depth chart you want:
Using older versions of Prism
Prism 1-5 doesn't let you rotate the graph 90 degrees to make a depth chart, but of course you can flip the page after you print it. Or you can copy and paste into some program that lets you rotate. SmartDraw (www.smartdraw.com; Windows) lets you rotate any object to any angle, so can do this easily. So can PowerPoint.