
Configuring Prism so new bar graphs don't have fill patterns.
Fill patterns on bar graphs date back to the era when graphs were made with pen plotters. While some people like them a way to distinguish among different data sets, many people prefer to fill bars from each data set with a different solid color.
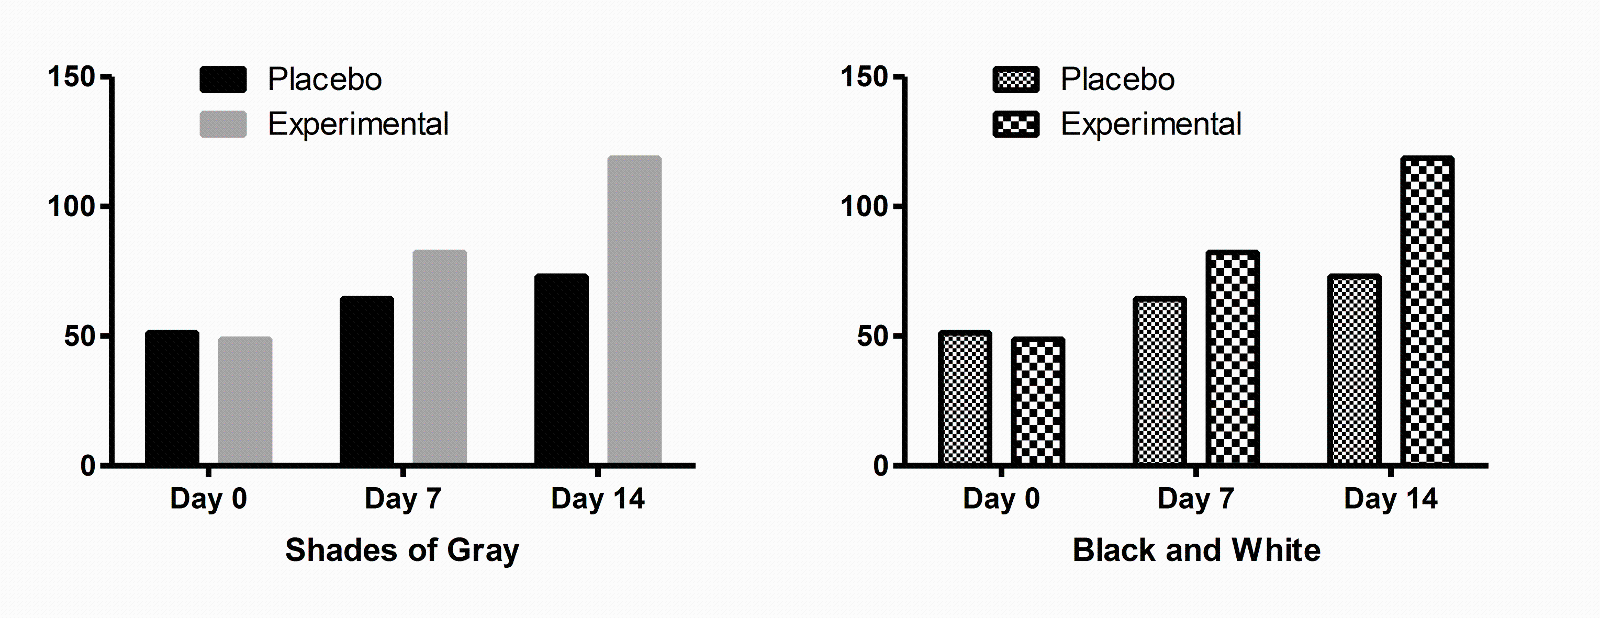
When you first use Prism, it is configured to use the Black and White color scheme. But you can change this in the New Graph tab of the Preferences dialog.
If you want to stick with black and white (and gray) for publication, chooe the Shades of Gray color scheme as your default.
Virtually all the built-in color schemes are set up to show solid bars. They do this by specifying the same color for the bar pattern and bar fill. The exceptions are: Black and White and Mustard Field. it is quite easy to create your own color schemes, and to define one you create as the default to use for new graphs.