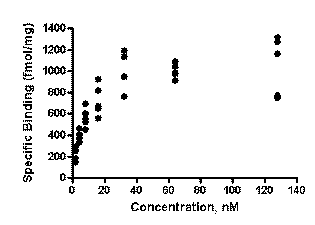
The advantage of showing every replicate instead of error bars
When making a XY graph, Column graph or Grouped graph, you don’t have to plot error bars. Instead you can graph each data point (replicate). This is often the best way to display variation, as it shows your data exactly. Don't plot mean or median with error bars too quickly. Stop to think about whether a graph of the actual data would be more informative.
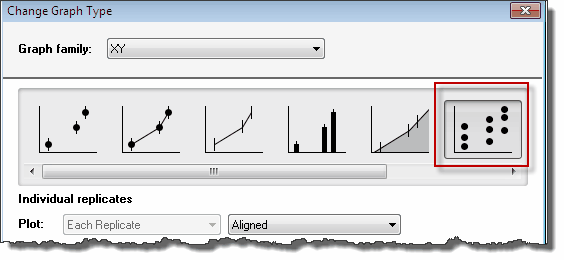
XY graphs
Choose Individual Replicates when you pick the error format for your graph.
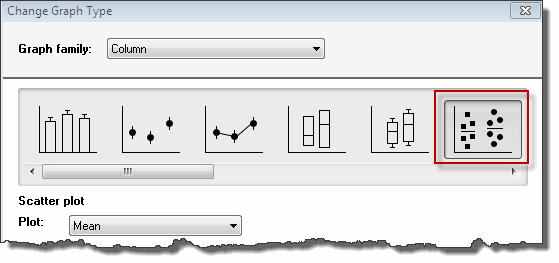
Column graphs
Choose to make a scatter plot.
Grouped graphs
Choose the Plot individual values tab. Then choose any of the graph types.
