Choosing to enter precalculated error values
When creating (or reformatting) a Grouped or XY table, you can choose to format the table for entry of preaveraged data.
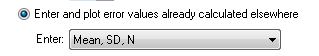
Here is the list of choices:
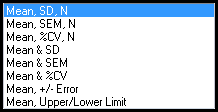
If you enter mean and SD or SEM, why also enter n?
If you only want to make a graph showing mean and SD or SEM, you only need to enter those values into the data table. It is ok to omit the "n" values, or to format the table for entry of Mean with SD or SEM, but without n.
It is necessary to enter n in these situations:
•You want to be able to switch between graphing SD, SEM and CI error bars. If you enter SD or SEM with n, Prism can switch between plotting whatever form of error value you want to show.
•You want to do statistical analysis. t tests, ANOVA and more require knowing sample size.
•You want accurate nonlinear regression. If you enter the data as mean and SD or SEM, Prism will fit the means, and ignore the values you enter as SD or SEM. If you also enter n, Prism can account for scatter and sample size, and the curve fit will be the same as if you had entered raw data.
What is the %CV?
The %CV is the coefficient of variation as a percentage, so is defined as 100*SD/Mean. Since the SD and Mean are in the same units, the %CV is a unitless percentage. This is only useful for ratio variables, where zero means none of that value. Weight is a ratio variable, because a weight of 0.0 means no weight. Temperature in C or F is not a ratio variable, because a temperature of 0.0 doesn't mean no heat.
The difference between entering +/- errors and upper/lower limit errors
It is easy to confuse the +/- and upper/lower choices for entry of preaveraged data. But the two are distinct.
•When you format the subcolumns for entry of +/- error values, the values you enter are interpreted as distances. These are added to (or subtracted from) the value you enter as the mean to compute the end point of the error bars.
•When you format subcolumns for entry of upper/lower Limit error values, the values you enter are interpreted as the end points of the error bars. The error bars will end at the Y values you enter.
What if I want to enter the median and quartiles, or some other kind of error bars?
If you choose to enter the mean, with sample size (n) and SD, SEM or %CV, you really ought to enter those exact values. Otherwise, analyses might be incorrect.
If you choose to format the data table with subcolumns for Mean and SD or SEM or %CV without sample size, or for mean with +- error values or upper and lower limits, no analyses will be possible. Or rather Prism will only analyze/fit the means and ignore the error values. If you choose to format the table so the subcolumns are labeled mean, upper limit, and lower limit, you are welcome to enter into those subcolumns the median plus the 25th and 75th percentiles, or whatever values you want. Prism will plot the error values you enter, and it is up to you to keep track of how these values were actually calculated, and to label your graphs accordingly.