The choice you make about how to format your data table is important. If you don't choose the appropriate kind of data table, you won't be able to make the kind of graph you want or perform the analyses you have in mind.
Information for formatting Multiple variables data tables is located on its own page.
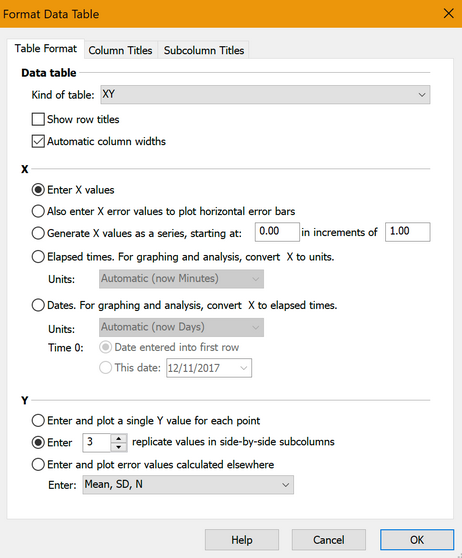
For XY and Grouped data tables, Prism uses subcolumns for replicate data. If your table needs more subcolumns you can always change the number of subcolumns (replicates) in a data table. Or, if you entered already-calculated error values but your table is labeled wrong (say you actually entered SD, but the table is formatted for SEM, you can make the switch.
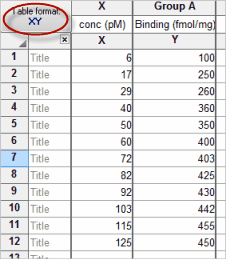
To change the format of a data table, Click on the Table format area in the upper left of a data table.

Alternatively, click on the Table Format button  on the Change toolbar.

If you want to change the type of error bars displayed on your graph, you don't need to change the data table. Instead, double-click on any data point on your graph to open the Format Graph dialog and use the drop-down menu to change the error-bar format.