Multiple variables data tables are different than the other types of data tables Prism creates. Because of this, the Format Data Table dialog for multiple variables data tables includes a number of important differences compared to the dialog for other table types.
To access the Format Data Table dialog, click on the Table format area in the upper left of the data table, or use the change data table format button in the toolbar.

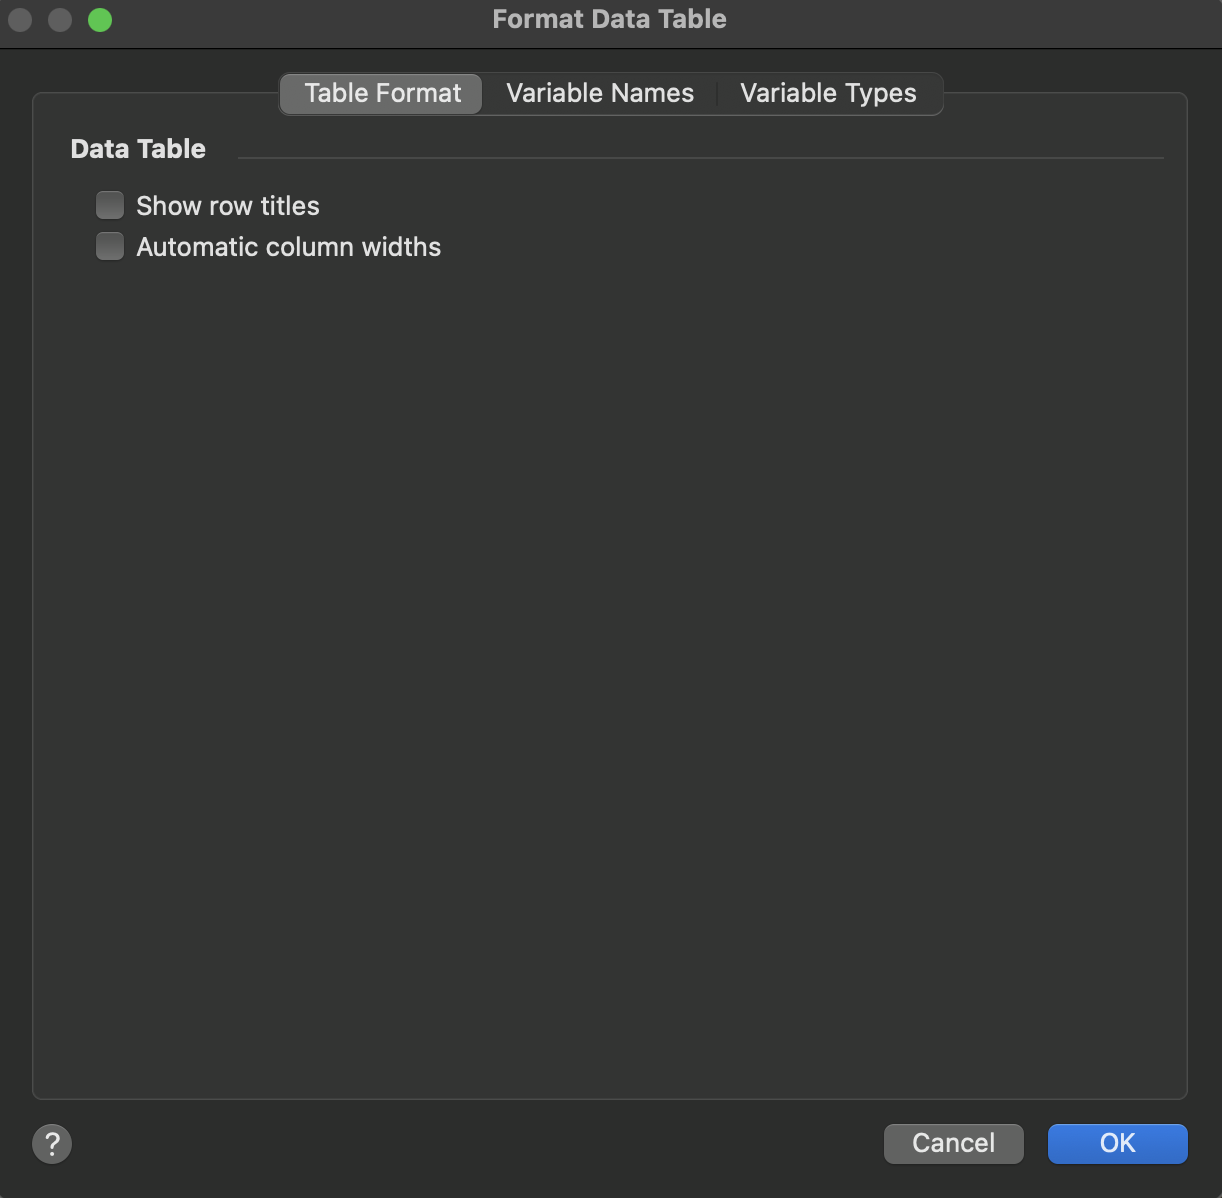
Controls on this tab allow you to show or hide the row title column on the data table, or to automatically adjust the width of all of the variable columns simultaneously.
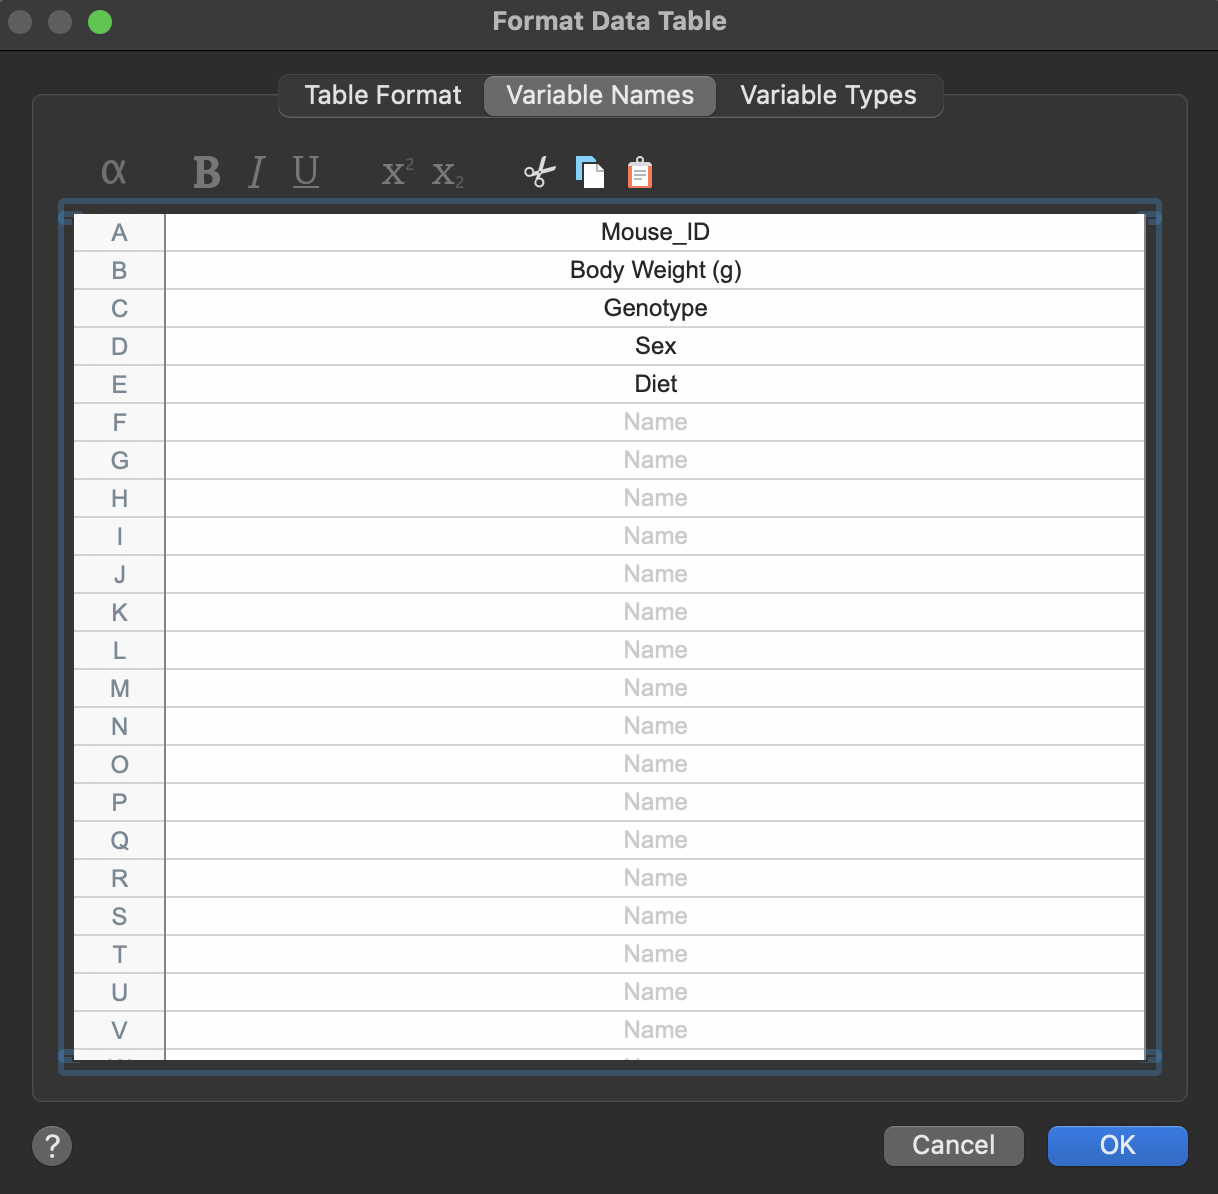
If your data table contains a large number of variables, this is likely the easiest way to view (or edit) all of the variable titles at once. As a shortcut to access this dialog tab, double-click on any of the variable titles on the data table.
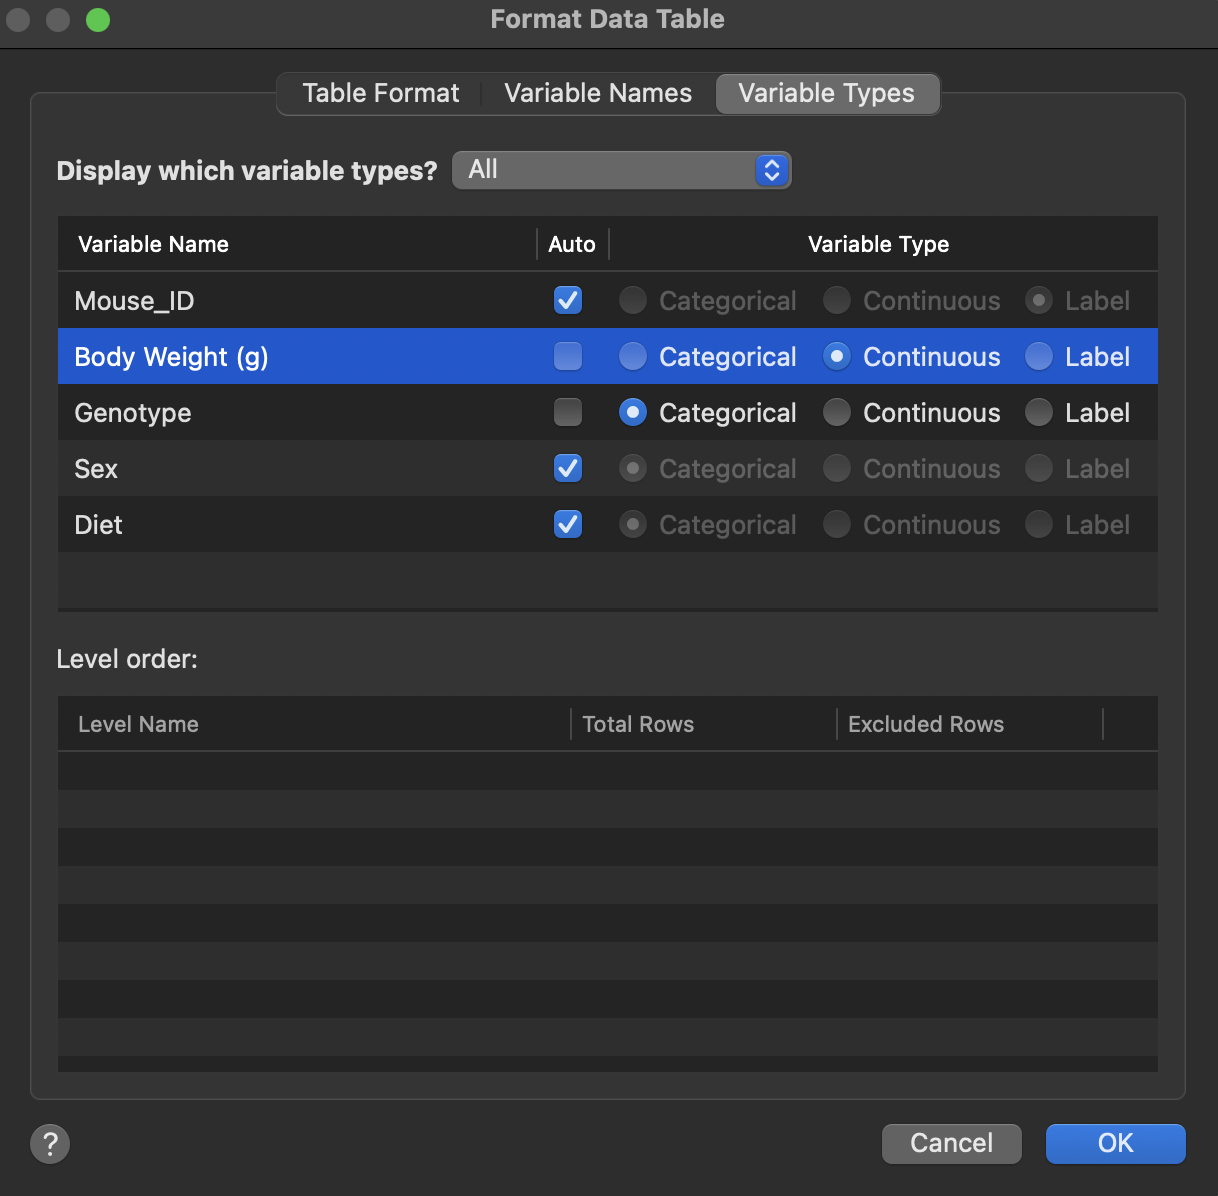
You can review and change the types of all variables in the this tab (filter the view by variable type using the dropdwon at the top of this tab). Note that if the "Auto" box is checked for a variable, Prism will attempt to assign a variable type based on the values (or text) entered for this variable. To assign a variable type manually, uncheck this box and select the desired type (variable types can also be assigned directly from the data table).
Additional information for categorical variables
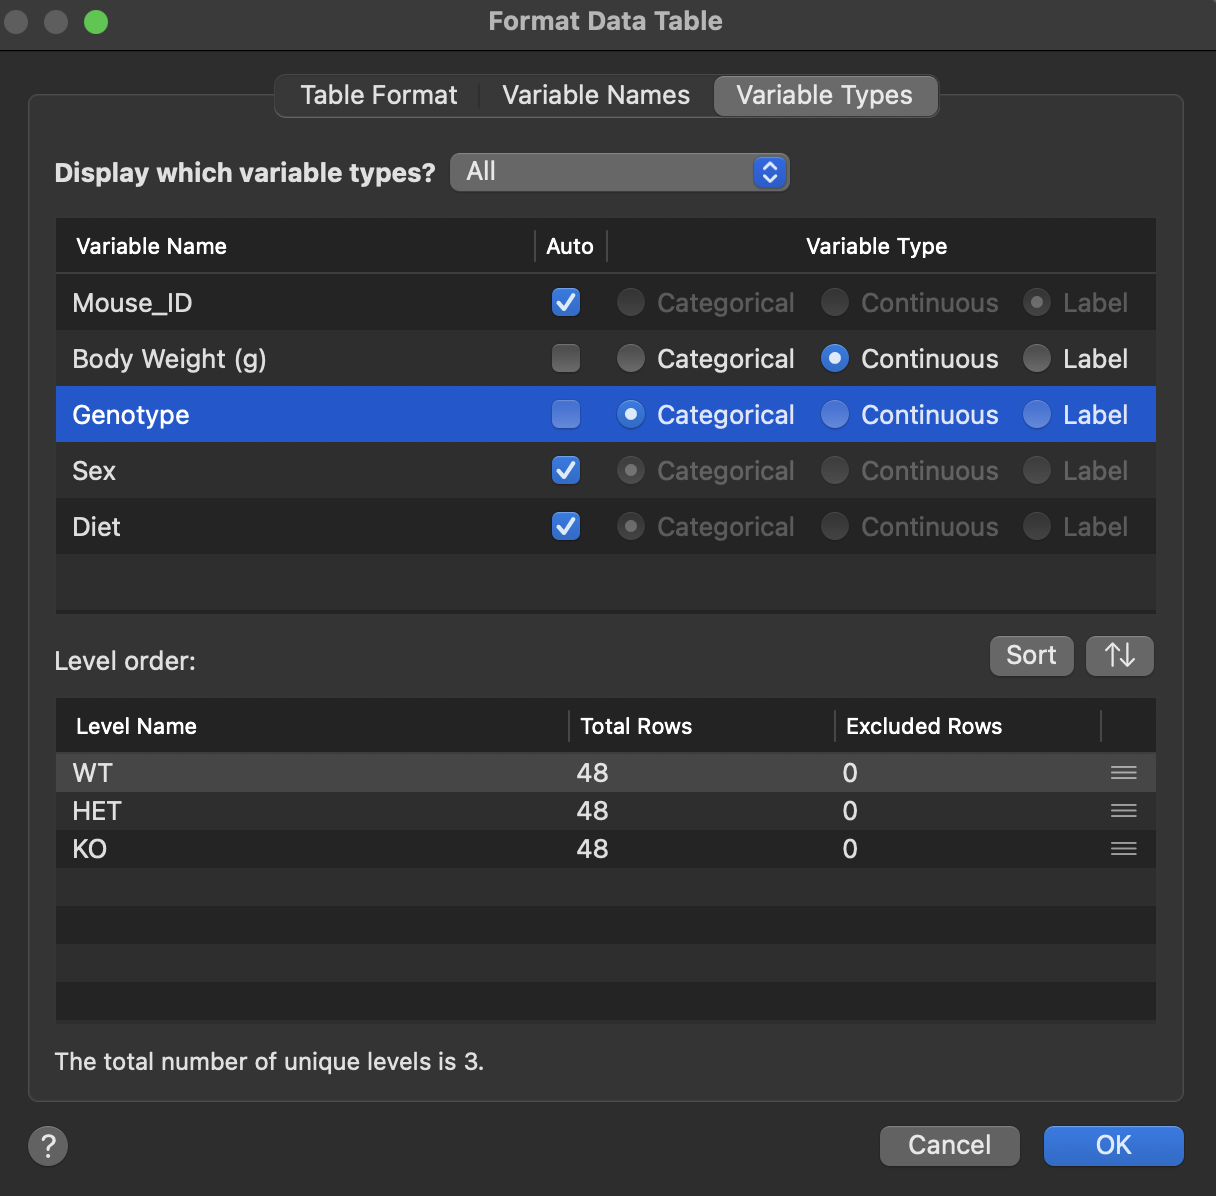
After selecting a categorical variable in the upper part of this tab, additional information for this categorical variable will be displayed in the lower section. Each unique level (group) within the categorical variable will be shown along with the total number and number of excluded rows in the data table.
Editing the level name for a specific level allows you to change each occurrence of this level name in the variable at once. For example, simply rename "Female" to "F" and every row in the data table with "Female" in this variable will be updated simultaneously.
Using this information can also be a quick way to spot errors in the data. For example, when entering or importing a large dataset, if "Mael" was entered instead of "Male", Prism will display this value on its own row in the dialog (see below). Simply correct the typo here, and Prism will automatically update it in the data table.
Features and functionality described in this section are available with our new Pro and Enterprise plans. Learn More... |
When a categorical variable is selected on the Variable Types tab, a Level Order section appears in the lower panel. Use this section to define the order in which levels are displayed across Prism -- on graph axes, in legends, and in analysis results. The order you set here is the primary, shared source of truth that all graphs inherit by default.
Reordering levels
Two methods are available:
•Drag and drop -- drag the handle next to any level row to move it to a new position.
•Sort actions -- click a sort button to apply a preset ordering. Available options are Entry Order, Name Order, Row Order, and Frequency Order. Use the ascending/descending toggle to control the direction. Each sort action is a one-time command that sets a new static order -- it is not a persistent rule that re-applies when data changes.
Once a new order is applied, it remains fixed until you explicitly change it. New levels added to the data are always appended to the end of the existing order. Renamed levels keep their current position.
How changes propagate to graphs
By default, every graph that uses a categorical variable is live-linked to that variable's data table order. Changes you make here are immediately reflected on all live-linked graphs.
A graph's live link can be broken if you manually reorder its levels from within the Format Graph dialog. A graph with a local override is no longer affected by changes made here. You can restore the live link at any time from the Level Order tab in the Format Graph dialog.
To set a graph-specific order without affecting the data table or other graphs, use the Level Order tab in the Format Graph dialog.