Prism lets you show both major and minor ticks on an axis. By default, Prism automatically sets the minimum and maximum range for an axis as well as the major tick interval.

For Continuous Axes
To change the major or tick interval:
Double click on an axis to open the Format Axes dialog. Uncheck the Auto box in the Range section and set the major tick interval in the Regularly Spaced Ticks section.
To show minor ticks:
Double-click on an axis to open the Format Axes dialog. Select an interval for minor ticks in the Regularly Spaced Ticks section. Choose the interval for minor ticks between major ticks and whether you want regular or log spacing. Select the number of intervals you want between major ticks, not the number of ticks. (For example, choosing four intervals creates three minor ticks.)
To hide ticks:
Double-click on an axis to open the Format Axes dialog. In the All Ticks section, choose None for Direction in the All Ticks section.
To change the direction and length of ticks:
Double-click on an axis to open the Format Axes dialog. Set the direction and length of ticks in the All Ticks section.
To place additional custom ticks or grid lines on a graph:
See: Additional ticks and grid lines.
For categorical axes of heat maps from multiple variables data
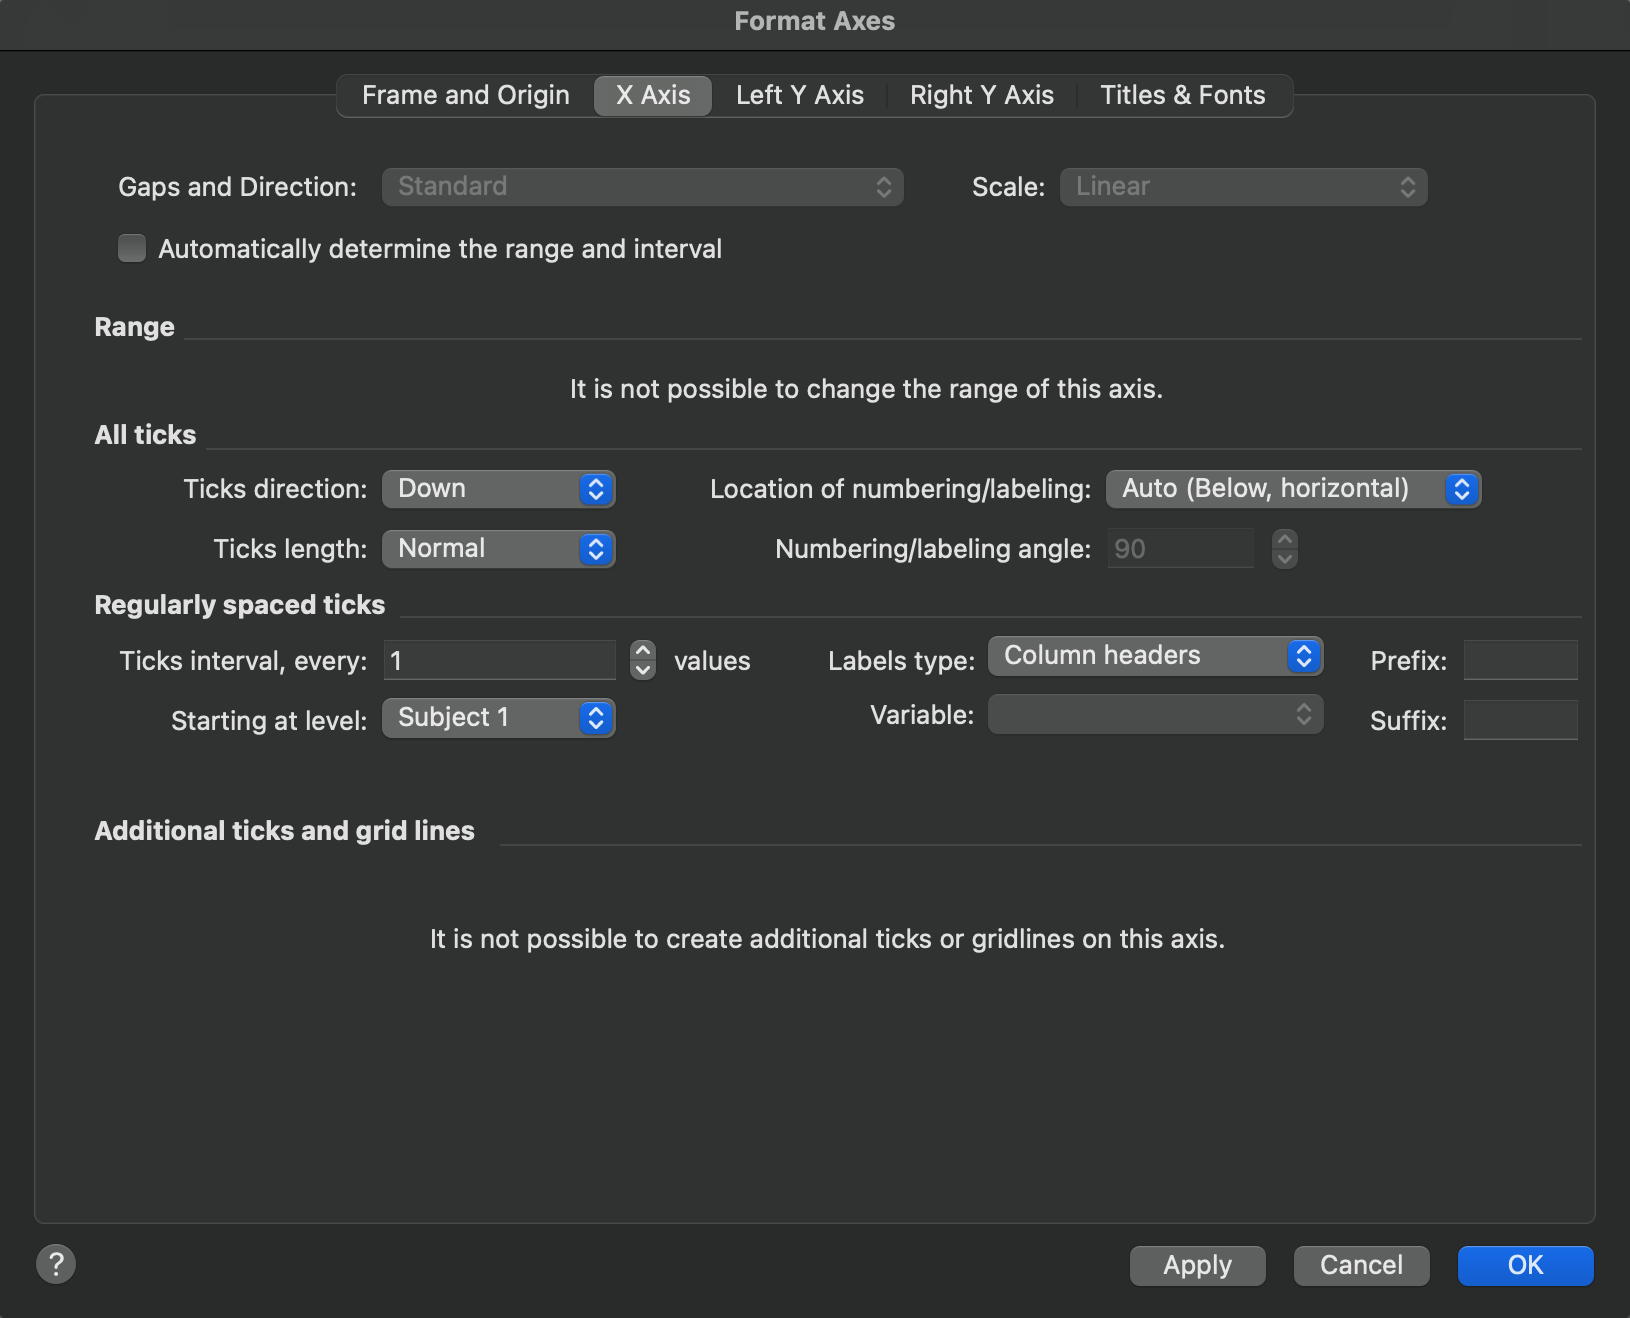
The ability to generate heat maps from multiple variables data was introduced in Prism 10.3.0. Because these graphs have categorical axes, the controls for specifying the ticks on the axes are a bit different.

For categorical axes, Prism always shows all levels/groups on the graph, so there is no way to adjust the "Range" of the axis. Similarly, there's no reason to display "minor" ticks between the markers for each of the levels/groups, so these options are also removed. Finally, the ability to add custom ticks and grid lines isn't applicable to these categorical axes, so these options are also removed. Some other options are identical or very similar to formatting a continuous axis.
To hide ticks:
Double-click on an axis to open the Format Axes dialog. In the All Ticks section, choose None for Direction in the All Ticks section.
To change the direction and length of ticks:
Double-click on an axis to open the Format Axes dialog. Set the direction and length of ticks in the All Ticks section.
To change the ticks interval and labels:
Double-click on an axis to open the Format Axes dialog. Look for the controls in the Regularly spaced ticks section:
•Ticks interval, every [ ] - these controls allow you to indicate how frequently you would like to have labels displayed for the ticks of the categorical axis. Increasing this number will reduce the frequency that labels are displayed, and can be helpful to reduce clutter of labels or to eliminate overlap of labels
•Starting at level - this control specifies the starting point for the interval used above. The labels for any levels on the axis before the selected value in this dropdown menu will not be shown
•Labels type - this controls how the labels for the axis ticks will be displayed. Options include Column headers/row titles, variable levels (requiring a variable be specified as well), Numbers (labels of 1, 2, 3...), or Letters (labels of A, B, C...)
•Prefix and Suffix - these work the same as for continuous axes. Text added to the Prefix field will be displayed before the tick label, while text in the Suffix field will be displayed after the tick label