Features and functionality described on this page are available with Prism Enterprise. |
The Heat map Options page of the format graph dialog allows you to add and customize this data object on graphs with the appropriate data structure.
Required data structure
There are two methods of defining the appropriate data structure for a heat map in Prism from multiple variables data. First, you may consider the input data as a matrix, and assign the “Columns” and “Rows” to the X and Y axis variables. Since there can only be one value for each row/column intersection, data in this form will simply be plotted with each value being assigned to its appropriate cell of the heat map. Consider the following data:
Col 1 |
Col 2 |
Col 3 |
|
Row 1 |
1 |
2 |
3 |
Row 2 |
4 |
5 |
6 |
Row 3 |
7 |
8 |
9 |
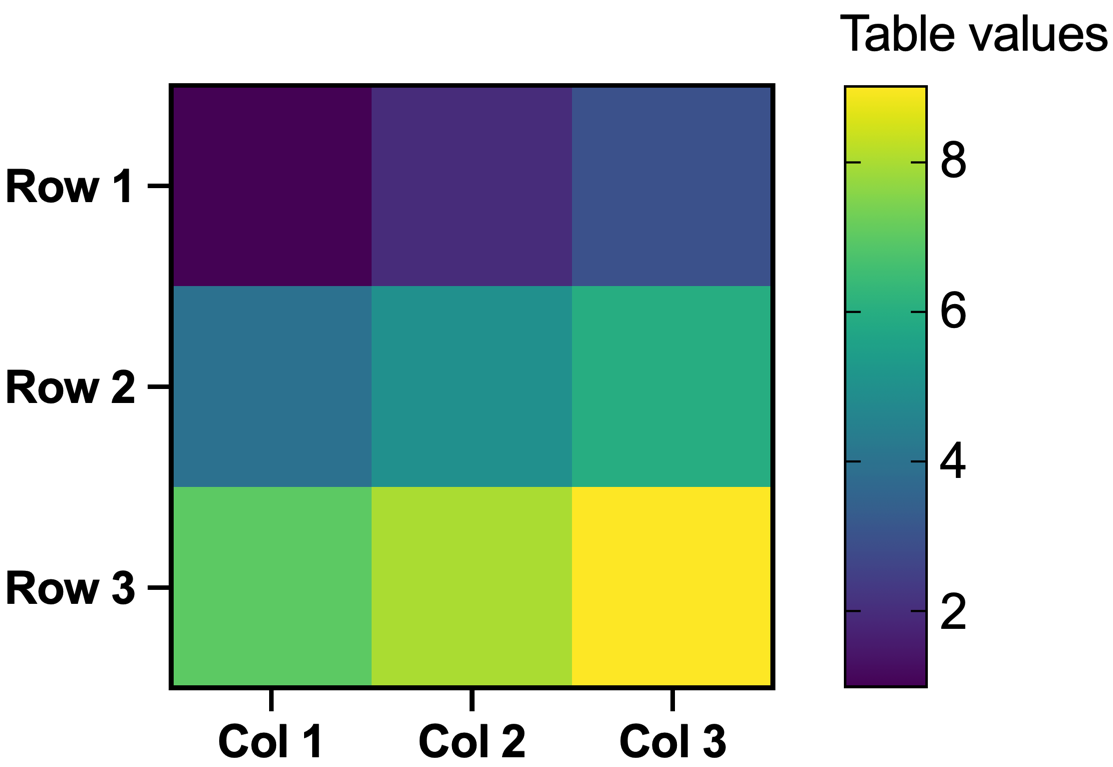
Using this data, it’s probably relatively simple to visualize what the resulting heat map would look like when assigning “Rows” to the vertical axis and “Columns” to the horizontal axis:
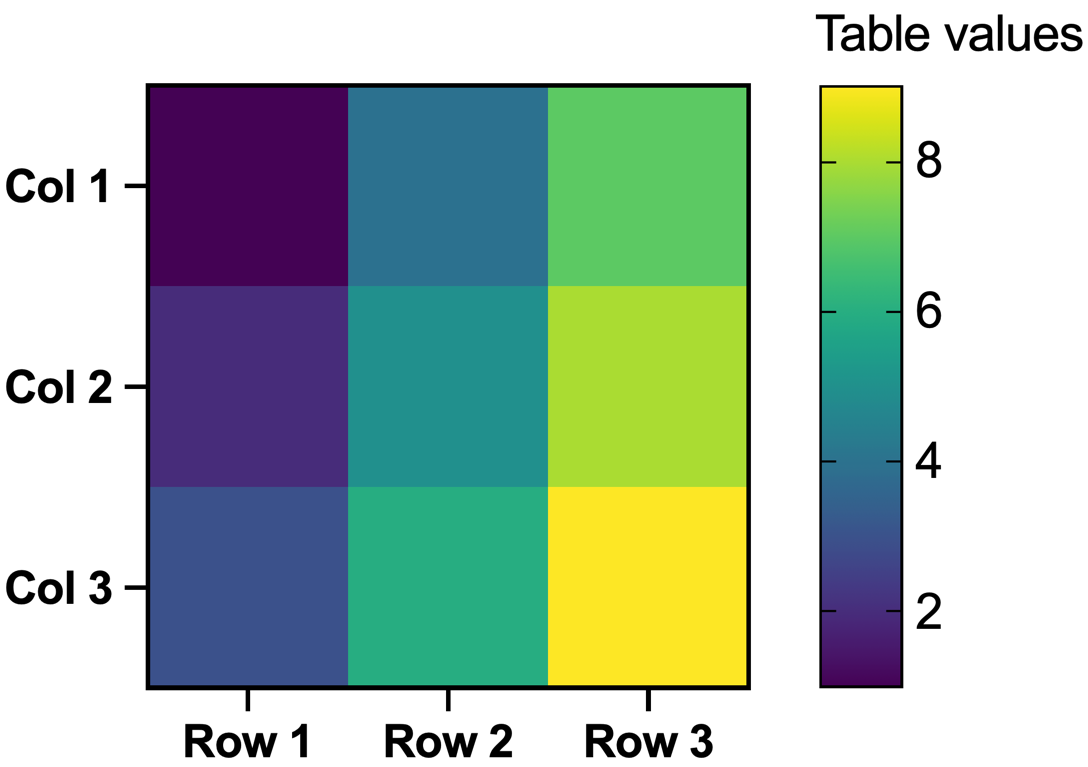
It’s also possible to assign the “Rows” of the data to the horizontal axis and the “Columns” of the data to the vertical axis, producing a slightly different visualization:
Alternatively, you may also choose to assign categorical variables to both the X and Y axis variables. For each assigned axis variable, the levels of the assigned categorical variable will become the groups on that axis of the heatmap. For example, if you chose a categorical variable with the levels “Small”, “Medium”, and “Large” for the X axis variable, then you would end up with a heat map consisting of three columns (one for each of these levels). Using this approach, the two categorical variables assigned to the axis will determine the general structure of the heat map, but you must provide additional information in order for Prism to know which values to display in the heat map itself. For this, you must also define a “Metric variable” which will be used to determine the values shown in the heatmap.
Consider the following data:
X axis variable |
Y axis variable |
Metric variable |
A |
A |
1 |
A |
B |
2 |
B |
A |
3 |
B |
B |
4 |
B |
B |
5 |
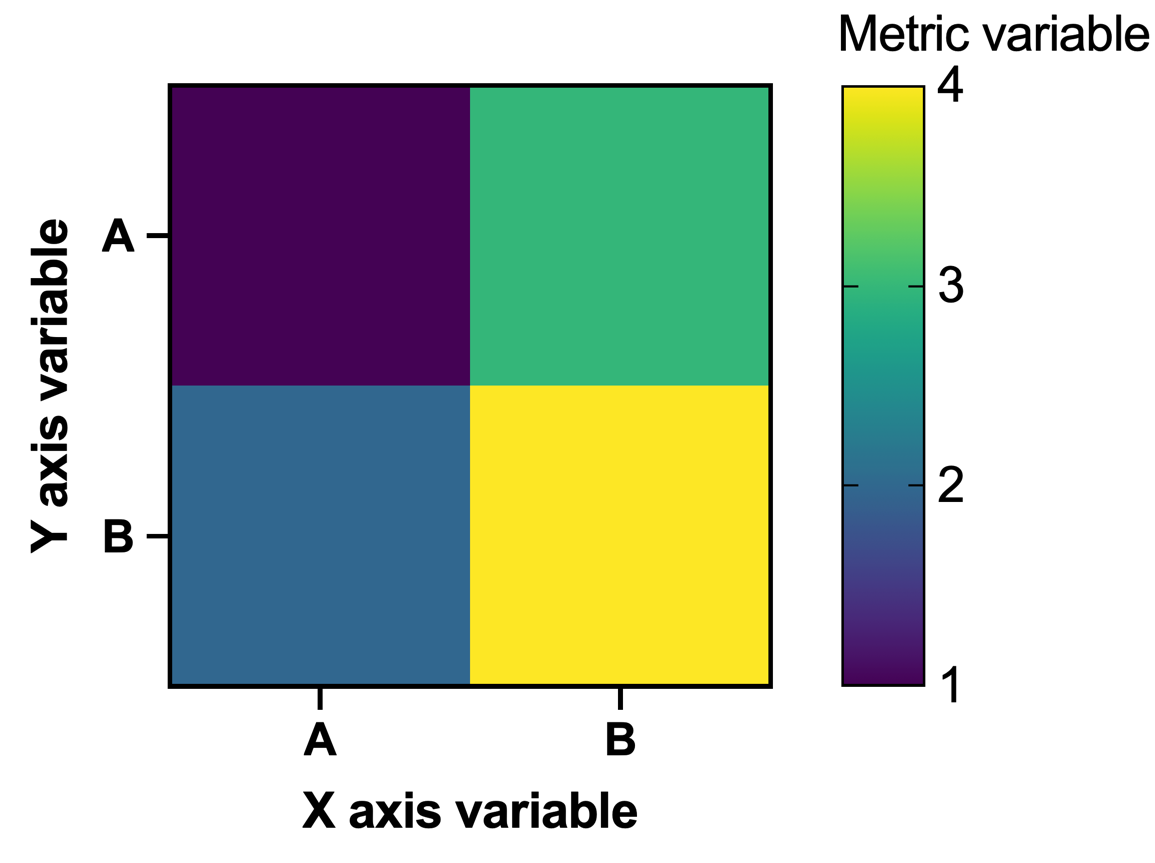
It’s possible to create a heat map by assigning the appropriate variables to the appropriate axes, but there’s a problem: the last two rows have the same values for the groups of the “X axis variable” and “Y axis variable”. What value should be plotted in the corresponding cell of the heat map? This is determined by assigning a “Metric” along with the “Metric variable”. For example, if the metric “Min” was selected, then the minimum of all values assigned to that location would be plotted (in this case 4):
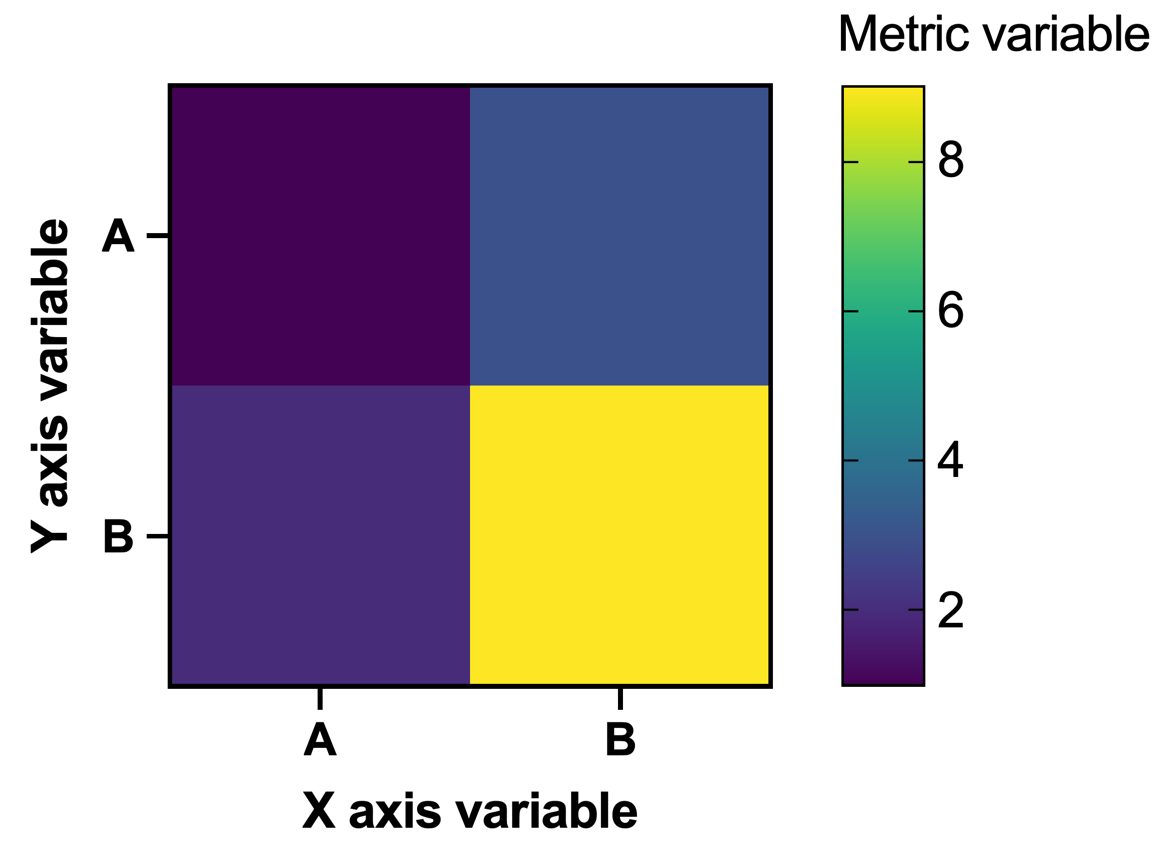
Alternatively, if “Sum” was selected, then the sum of all values assigned to each location would be plotted (in this case, 9 = 4+5):
There are two cases when categorical variables can be assigned to the X and Y axes, and no metric variable is required. This occurs when the selected metric is either “Count” or “Proportion”. In these cases, the plotted value either represents the raw number of times a given combination of levels occurs in the input data (Count), or the proportion of times each combination occurs int he data as a fraction of the total number of rows (Proportion).
Format Options
The checkbox at the top of the options page will allow you to toggle on or off the heat map on the graph. On macOS, this is a toggle as opposed to a checkbox.
Once enabled, you will be able to specify additional formatting options for the heat map, including:
•Metric and metric variable information (depending on data structure; see above)
•Colormap
•Heat map borders
Metric
These controls allow you to specify which metric to use when aggregating values defined by the selected metric variable. Note that these options are only enabled if the heat map structure was defined by assigning a categorical variable to both the X axis and Y axis. The options available for metric include:
•Count - does not require (or allow) a metric variable assignment. Each cell of the heat map represents the frequency of the corresponding level combination of the X and Y axis variables in the input data
•Proportion - does not require (or allow) a metric variable assignment. Each cell of the heat map represents the proportion of the corresponding level combination of the X and Y axis variables in the input data as a fraction of the total number of rows
•Mean - each cell of the heat map represents the average of all metric variable values on rows with the corresponding level combination of the X and Y axis variables in the input data
•Median - each cell of the heat map represents the median of all metric variable values on rows with the corresponding level combination of the X and Y axis variables in the input data
•Geometric Mean - each cell of the heat map represents the geometric mean of all metric variable values on rows with the corresponding level combination of the X and Y axis variables in the input data
•SD - each cell of the heat map represents the standard deviation of all metric variable values on rows with the corresponding level combination of the X and Y axis variables in the input data
•SEM - each cell of the heat map represents the standard error of the mean of all metric variable values on rows with the corresponding level combination of the X and Y axis variables in the input data
•Variance - each cell of the heat map represents the variance (square of the standard deviation) of all metric variable values on rows with the corresponding level combination of the X and Y axis variables in the input data
•%CV - each cell of the heat map represents the coefficient of variation (standard deviation divided by the mean) of all metric variable values on rows with the corresponding level combination of the X and Y axis variables in the input data
•Sum - each cell of the heat map represents the sum of all metric variable values on rows with the corresponding level combination of the X and Y axis variables in the input data
•Min - each cell of the heat map represents the minimum of all metric variable values on rows with the corresponding level combination of the X and Y axis variables in the input data
•Max - each cell of the heat map represents the maximum of all metric variable values on rows with the corresponding level combination of the X and Y axis variables in the input data
•Range - each cell of the heat map represents the range (maximum - minimum) of all metric variable values on rows with the corresponding level combination of the X and Y axis variables in the input data
•Categorical - requires a categorical metric variable assignment. Rather than assigning a color map to the values of the heat map, you’ll be able to assign specific colors properties to each level of the categorical metric variable, and these colors will be displayed appropriately. Note that if there are multiple rows with the same X and Y axis variable levels when using this metric, only the level of the metric variable in the first occurrence of each combination will be used for creating the heat map.
Colormap
These options allow you to define the color options of the heat map. Choose from one of the built in color maps that Prism offers, or define your own single gradient or double gradient colormap. By default, Prism will determine appropriate values for the smallest and largest values of the colormap (and baseline value if applicable). However, you may choose to define these values manually. If any values of the input table are outside of the range defined by these smallest and largest values, Prism will allow you to specify a color to display these values on the heat map (this color may optionally be applied to non-numeric values in the input data as well).
Finally, Prism offers the ability to specify a transparency value to apply to the colors of the heat map, and to specify a color for blank or excluded values as well as whether to include an “X” on cells for these blank or missing values.
Borders
By default, internal cell borders of Prism heat maps are disabled. However, you may use the options of this section to enable these internal borders, and specify their visual properties including:
•Color
•Transparency
•Thickness
•Line style