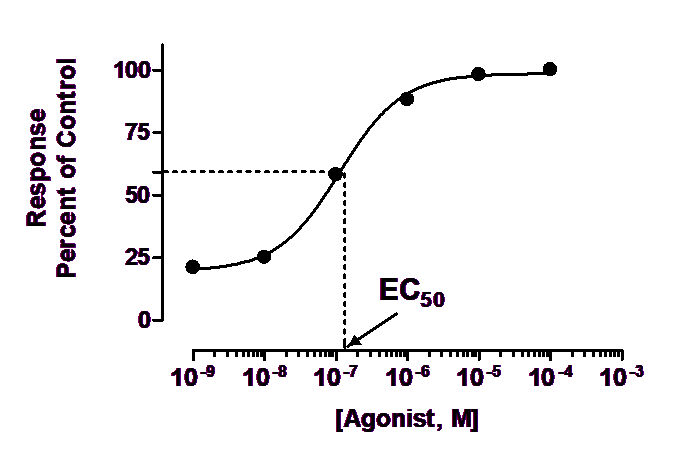
What is the EC50?
The EC50 is defined quite simply as the concentration of agonist that provokes a response halfway between the baseline (Bottom) and maximum response (Top). It is impossible to define the EC50 until you first define the baseline and maximum response.
Depending on how you have normalized your data, the EC50 may not be the same as the concentration that provokes a response of Y=50. For instance, in the example below, the data are normalized to percentage of maximum response, without subtracting a baseline. The baseline is about 20%, and the maximum is 100%, so the EC50 is the concentration of agonist that evokes a response of about 60% (halfway between 20% and 100%). The concentration that provokes a response of 50 in this experiment is not the EC50.

Don't over interpret the EC50. It is simply the concentration of agonist required to provoke a response halfway between the baseline and maximum responses. Because the EC50 defines the location of the dose-response curve for a particular drug, it is the most commonly used measure of an agonist’s potency. However, the EC50 is usually not the same as the Kd for the binding of agonist to its receptor -- it is not a direct measure of drug affinity.
The pEC50
The pEC50 is defined as the negative logarithm of the EC50. If the EC50 equals 1 micromolar (10-6 molar), the log EC50 is –6 and the pEC50 is 6. There is no particular advantage to expressing potency this way, but it is customary in some fields.
The IC50
In many experiments, you vary the concentration of an inhibitor. With more inhibitor, the response decreases, so the dose-response curve goes downhill. With such experiments, the midpoint is often called the IC50 ("I" for inhibition) rather than the EC50 ("E" for effective). This is purely a difference in which abbreviation is used, with no fundamental difference.
ECanything
A simple rearrangement of the equation lets you fit EC80 (or EC90 or ECanything) instead of the EC50. Prism includes an equation that fits any EC value directly.
