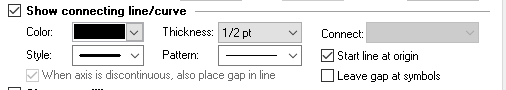
Check on option in the Format Graph dialog to connect the XY points with point to point lines.
Notes:
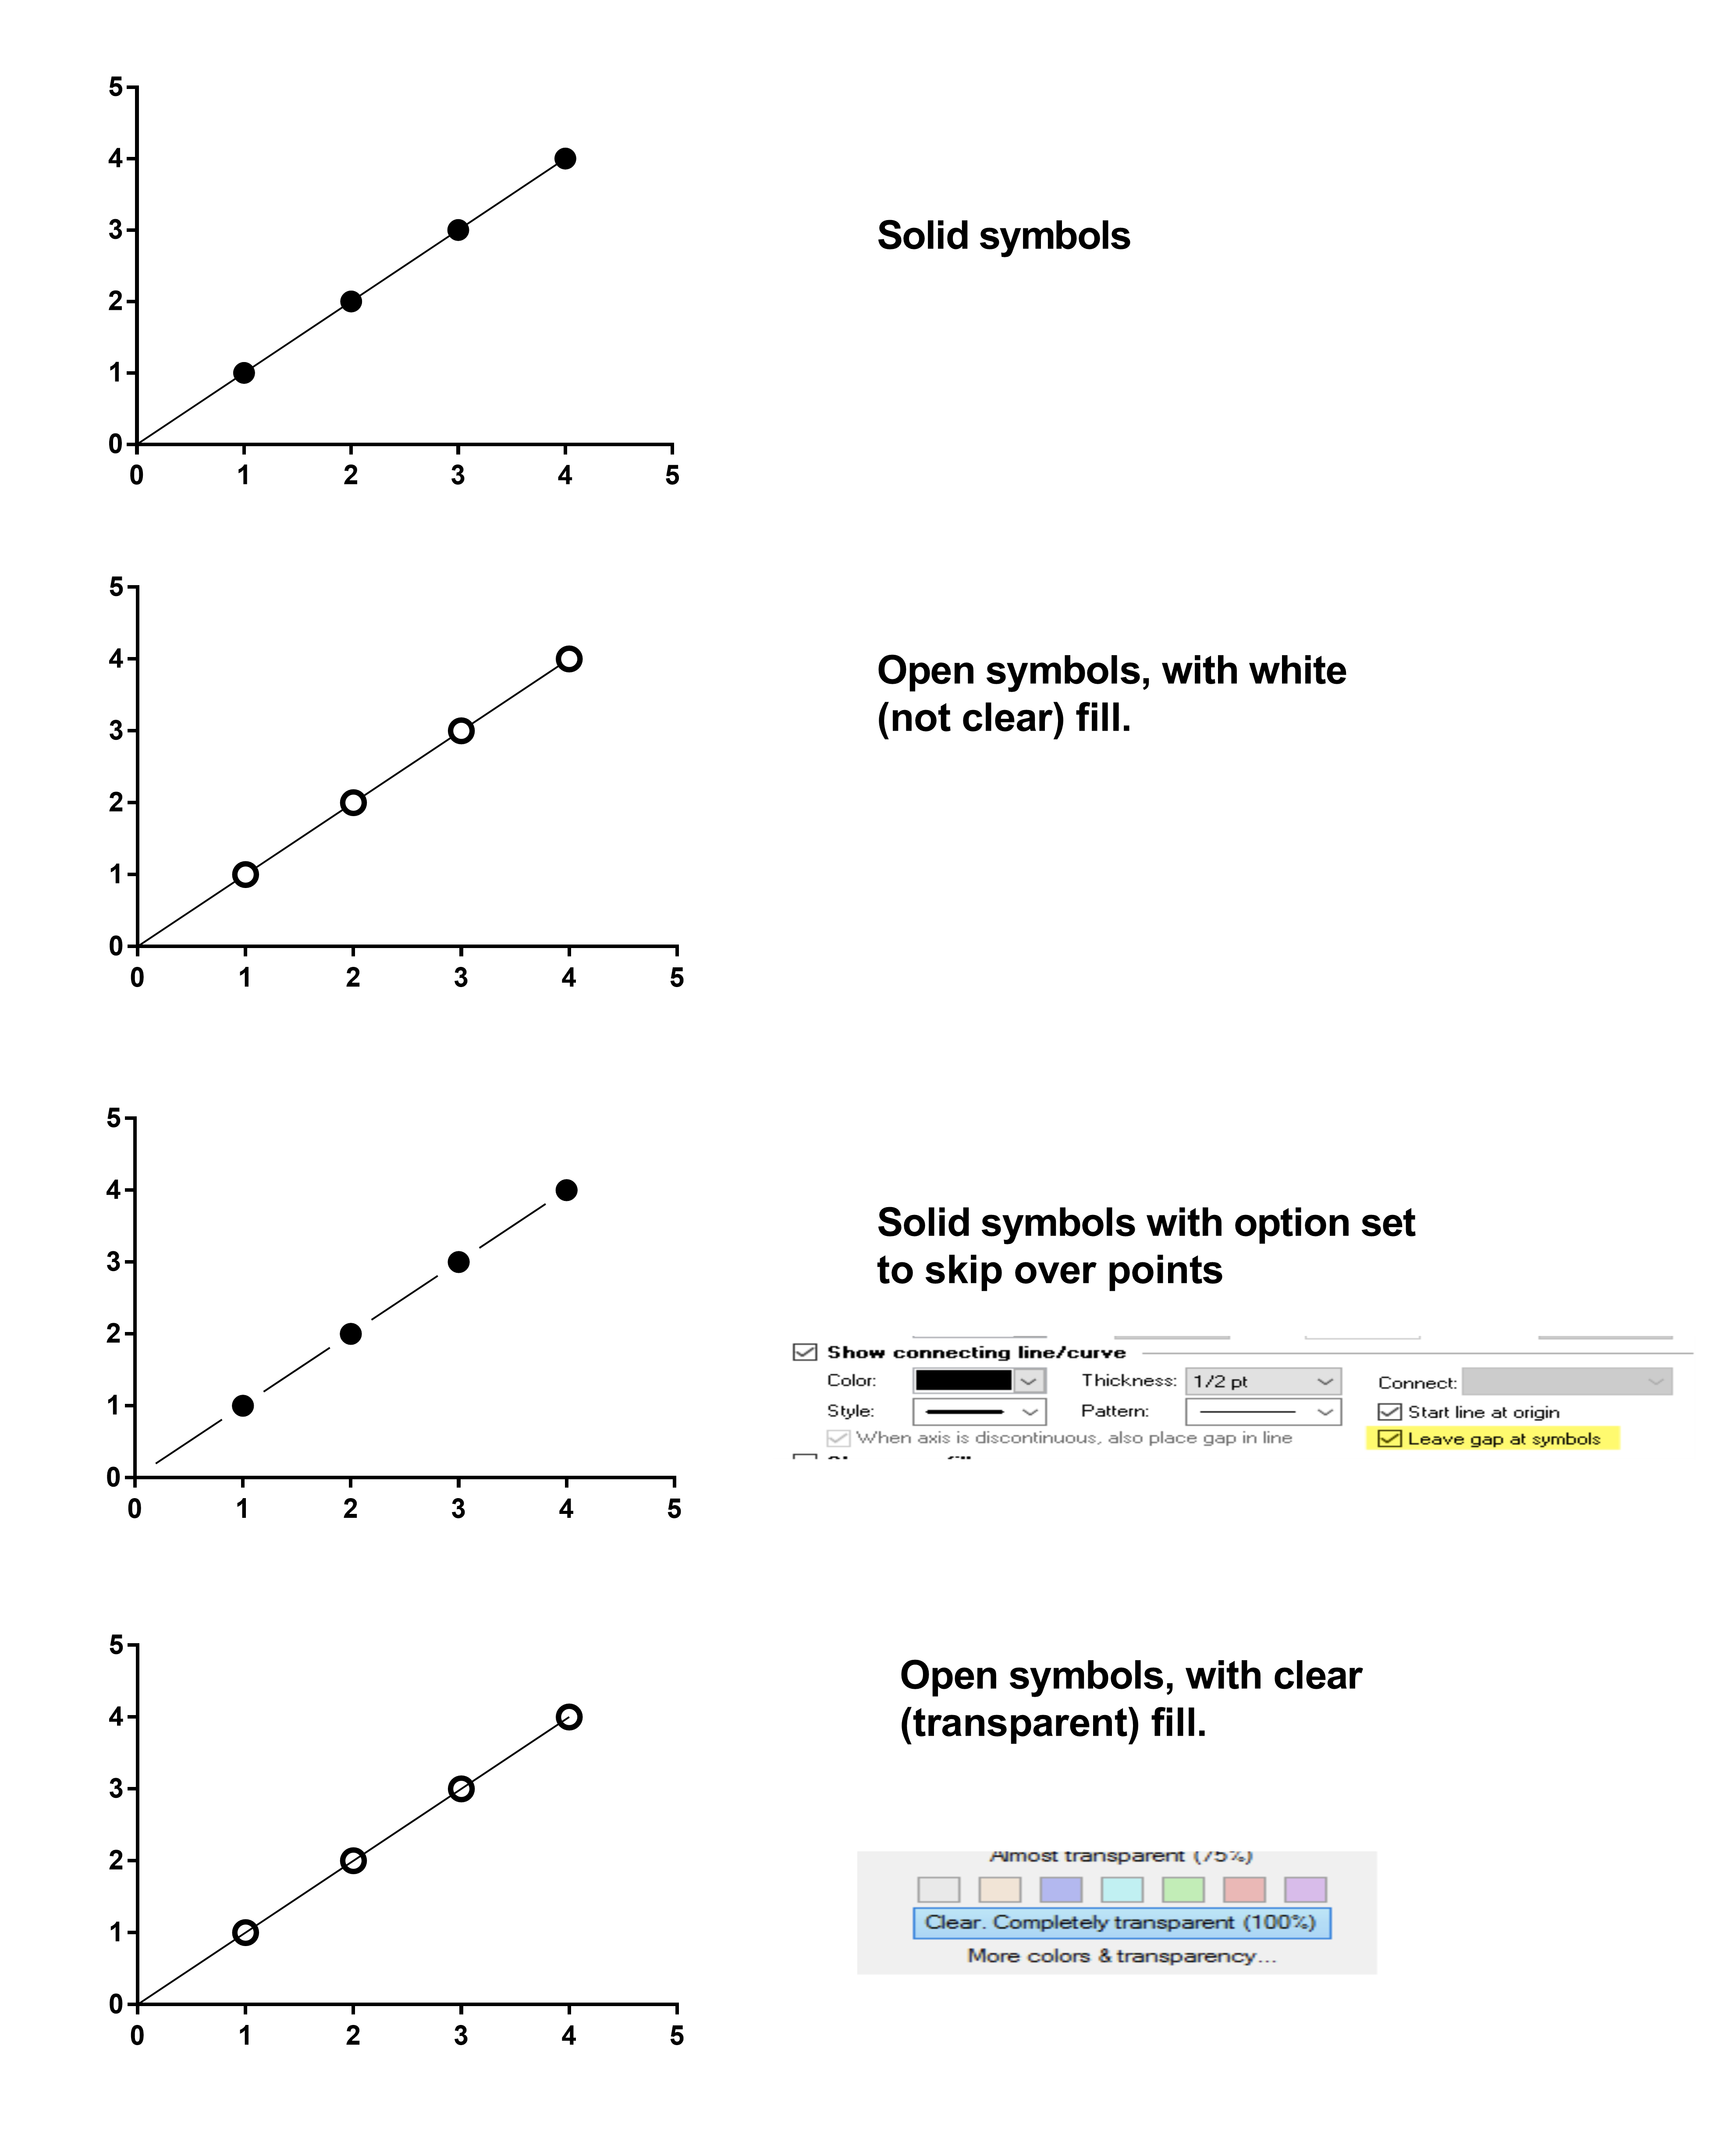
•You can choose to have the line begin at the origin by checking an option. Otherwise, the line starts with the first point.
•The lines are drawn point to point in the order the data are in the data table, which may not be in the order of the X values. But note that there is a Sort-by-X-Value command on the Edit menu you see when looking at an XY data table.
•The graphs below show four ways to draw these lines. The bottom choice is one you probably want to avoid. That graph uses open symbols with clear (transparent) fill so the point-to-point lines will be visible going through (or under) the points. You want to use white (or whatever the background color is) fill color which covers up the point-to-point lines.