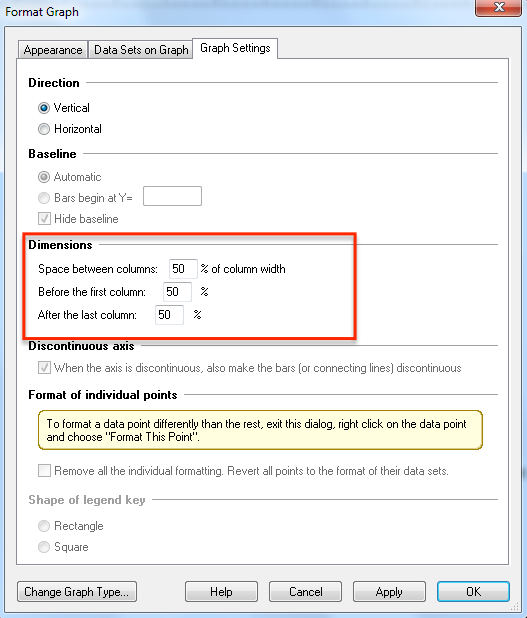
Set the standard spacing between columns
To change the standard spacing between individual bars (or array of column scatter points), go to the Graph Settings tab. If you enter a larger value, the gaps between bars will be wider so the bars will be narrower. You can also set the gap before the first and after the last column.
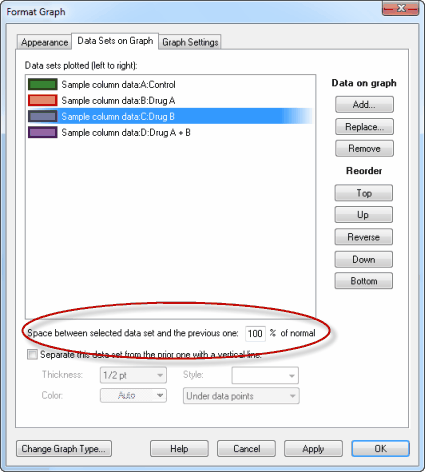
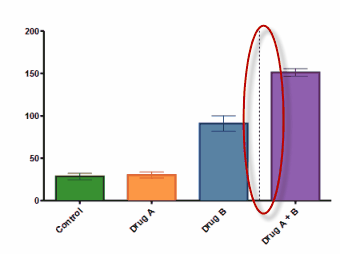
Changing the spacing between selected columns
To change the space between two adjacent bars, go to the Data Sets on Graph tab. Select a data set and enter (at the bottom of the dialog) the percentage of normal spacing you want between that data set and the prior one. If you enter 200, that bar will be twice as far from its left neighbor as the others. If you enter 50, it will be half as far. If you enter 0, this bar will touch the neighbor on the left.
Note one possible source of confusion.
When you enter a value here as the space between a selected data set and the prior one, you enter the percentage of the gap set in the Graph Settings tab. If you enter 200%, you are setting the gap between the selected data set and the prior one to be twice as large as the usual gap.
When you enter a value on the graph settings tab as space between columns, enter the percentage of the width of the bar (or plotting area for the set of scatter symbols). A value of 50%, means the gaps between bars are half as wide as the width of the bars.
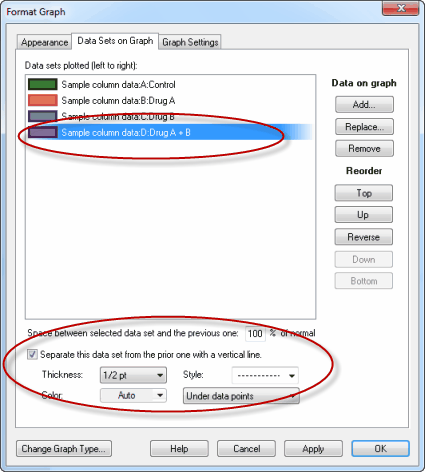
Adding a line between adjacent columns
To add a line between two adjacent bars, go to the Data Sets on Graph tab. Select a data set and enter (at the bottom of the dialog) the specifications of the line you desire.
Empty columns
An alternative way to leave a gap is to create an additional data set column on the data table, enter only a single number (usually 0), and include it on the graph. If the baseline of the graph is 0.0, and that value is 0.0, then Prism will draw a zero height bar, which is essentially a gap.