This five-minute tutorial will show you a bit about how Prism is organized.
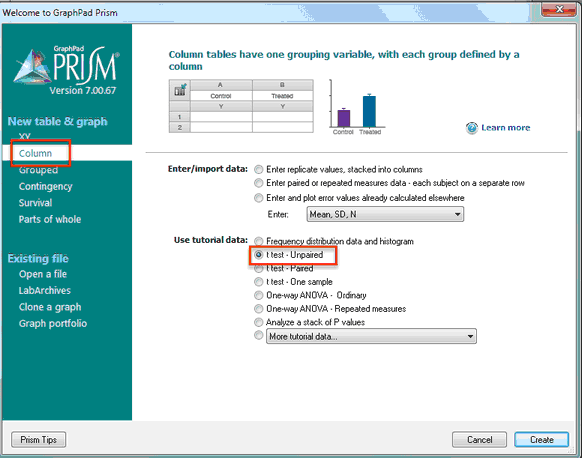
1.When you start Prism, you'll see the Welcome dialog. You'll see six tabs representing the six kinds of data tables. Click on the Column tab. Then choose to use tutorial data for an unpaired t test.
Notes:
•To use Prism effectively, you need to learn how to choose which of the six types of data table to select.
•Note the distinction between choosing sample data or creating an empty table into which you can enter or import data.
•Choosing the tutorial data for the unpaired t test only fills the table with data. You'll choose an analysis in the next step.
2.Note that the tutorial data comes with a floating yellow note that briefly explains the data format, and links to more detailed online help.
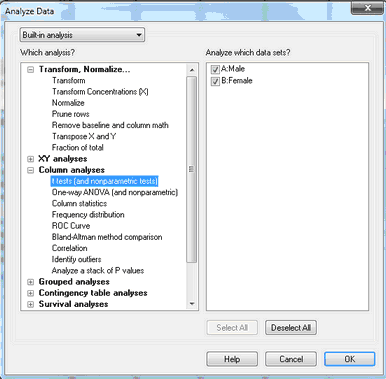
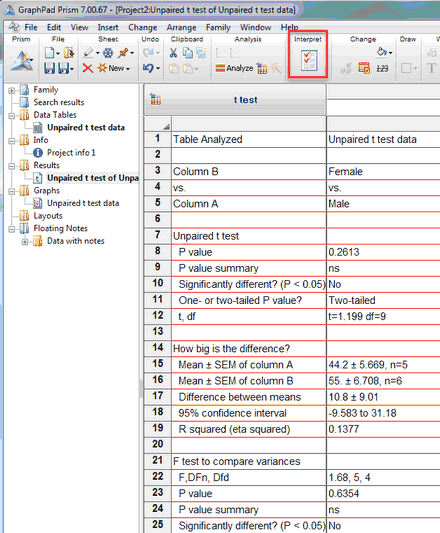
3.From the data table, click Analyze and then choose the t test analysis. Alternatively, click the t test shortcut button above the Analyze button.

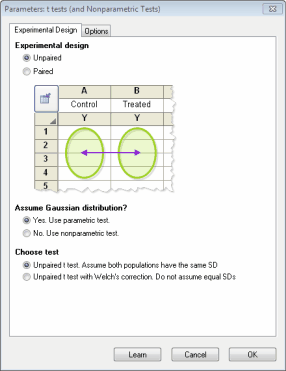
4.On the first tab of the t test dialog, confirm that the experimental design in unpaired and that you want to assume a Gaussian distribution and to perform an unpaired t test. For now, you can accept all the defaults on the second tab. Click the Learn button to read explanations of all the choices..
5.View the results. Click the analysis checklist button to help interpret the results. Click the Results button in the upper left corner to open the Analysis Parameters dialog to perhaps change to a paired or nonparametric test.
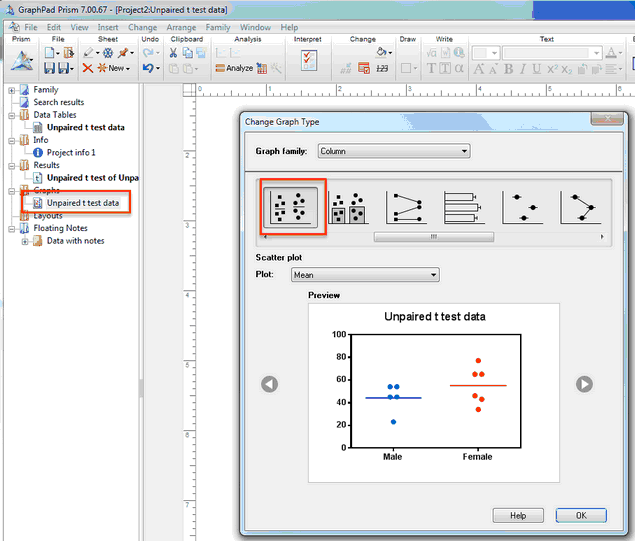
6.In the navigator on the left, click on "Unpaired t test data" in the graphs section. The Change Graph Type dialog will pop up. Choose the kind of graph you want, and see how that choice will look. We suggest choosing a Scatter plot, and plotting a line at the mean.