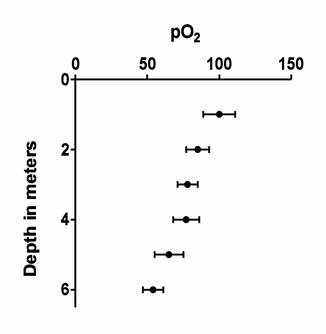
•Depth charts. When you assign a graph to a layout, you can specify that it be rotated 90 degrees. This essentially creates an XY graph where the independent (X) variable is shown on the vertical axis. As the graph's name suggests, this kind of graph is used in fields where the independent variable is depth, which is naturally shown on the vertical axis.

•Label both sides of the axis. Place additional ticks and labels across the axis from the regular numbering. This is helpful, for example, when X is time, but you also want to label particular times when an experimental intervention was performed.

•Faster graphing. Regenerating graphs with tens or hundreds of thousands of points can be slow. If you are impatient, Prism 6 lets you specify that a graph only show one out of every K points (you specify K), to speed up graphing on screen. It also lets you work on the graph (move things around, add text or drawings, change axis properties, etc.) as the data points are plotted on screen.
•Create a graphs with only a right Y axis. Prism has always made it easy to add a right Y axis as a second axis. But it has been difficult to create a graph with a single Y axis positioned on the right side. To do this with Prism 5 can requires positioning the "left" (only) Y axis in on the right side of the graph, and then assigning data sets to the “left” axis, even though it is on the right side of the graph. Confusing! Prism 6 makes this more straightforward. Turn off the left Y axis, and create a right Y axis to which you assign data sets.
•More subcolumns. Prism 6 allows up to 256 subcolumns for replicates. Prism 5 allowed only 52.