This analysis takes as input a multiple variable table, and creates another table of a different type (XY, Column, Grouped or Contingency) from a subset of data. If you want to create another multiple variable table, this is the wrong analysis to use. Use this one instead.
The dialog has two tabs:
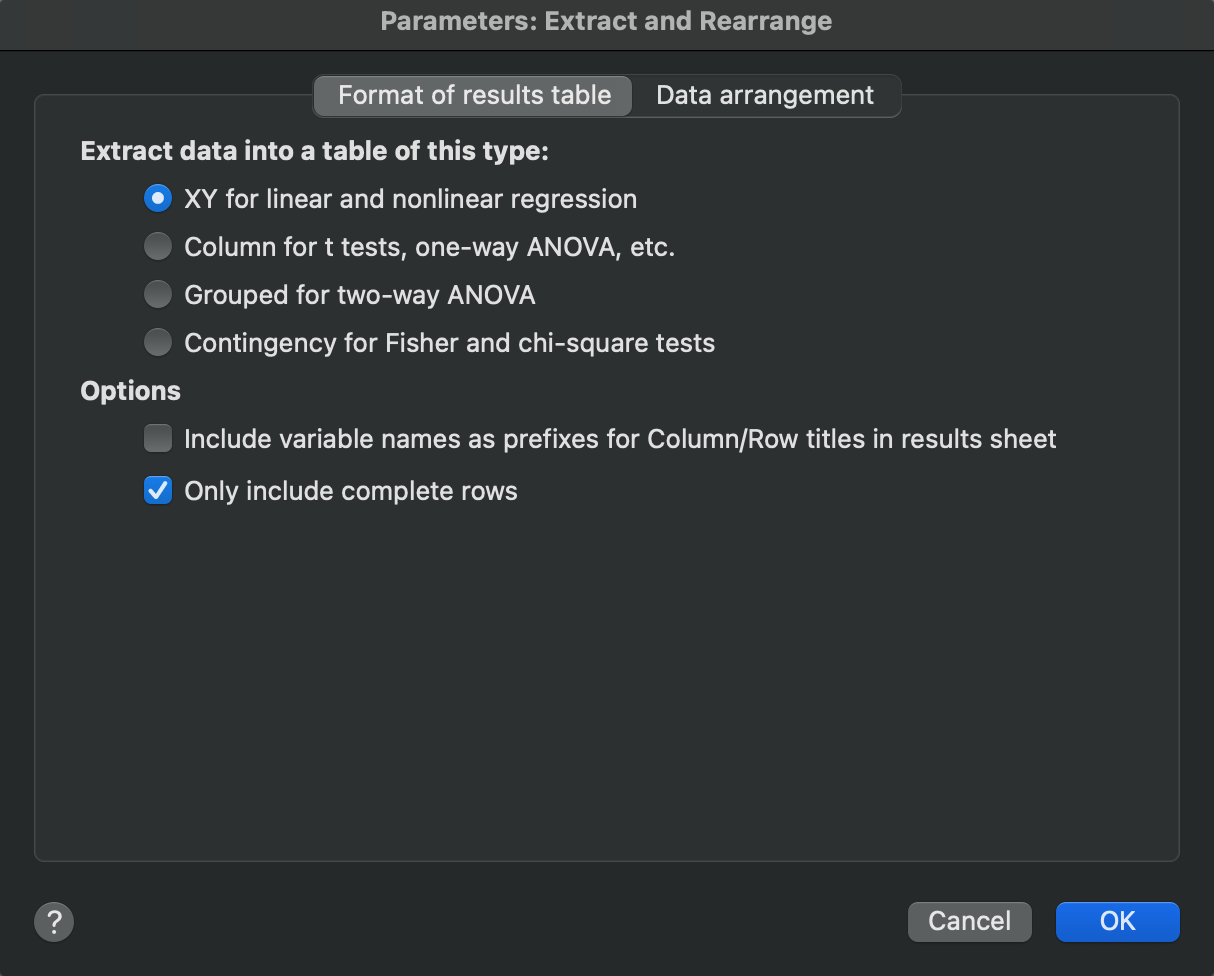
Format of results table
On the first tab, decide which kind of table you want to create.

Options
In addition to selecting the table type, there are two additional options available:
•Include variable names as prefixes for Column/Row titles in results sheet - When checked, this option adds the variable name as a prefix to column titles in the output. For example, if "Sex" is the variable name with levels "Female" and "Male", the output column titles would be Sex = "Female" and Sex = "Male".
•Only include complete rows - This option determines whether "empty" rows in the output should be retained or not. Another way to think about this is whether to maintain the original data row order in the structure of the results. Based on the design of the extract and rearrange variables used to determine the output data structure, some rows/combinations may not exist in the data.
oWhen checked: The placement of data in the output may not totally reflect the arrangement of data from the input. The data will be condensed to eliminate unnecessary empty space in the output table.
oWhen unchecked: For Column tables and XY tables without replicates, the data in the output will be placed on the same row as the corresponding value in the input (barring information about replicates/subjects), maintaining the original row structure. For tables with replicates (XY or Grouped), the effects will be similar, shifting data where possible within subcolumns of the appropriate row/column to eliminate empty cells.
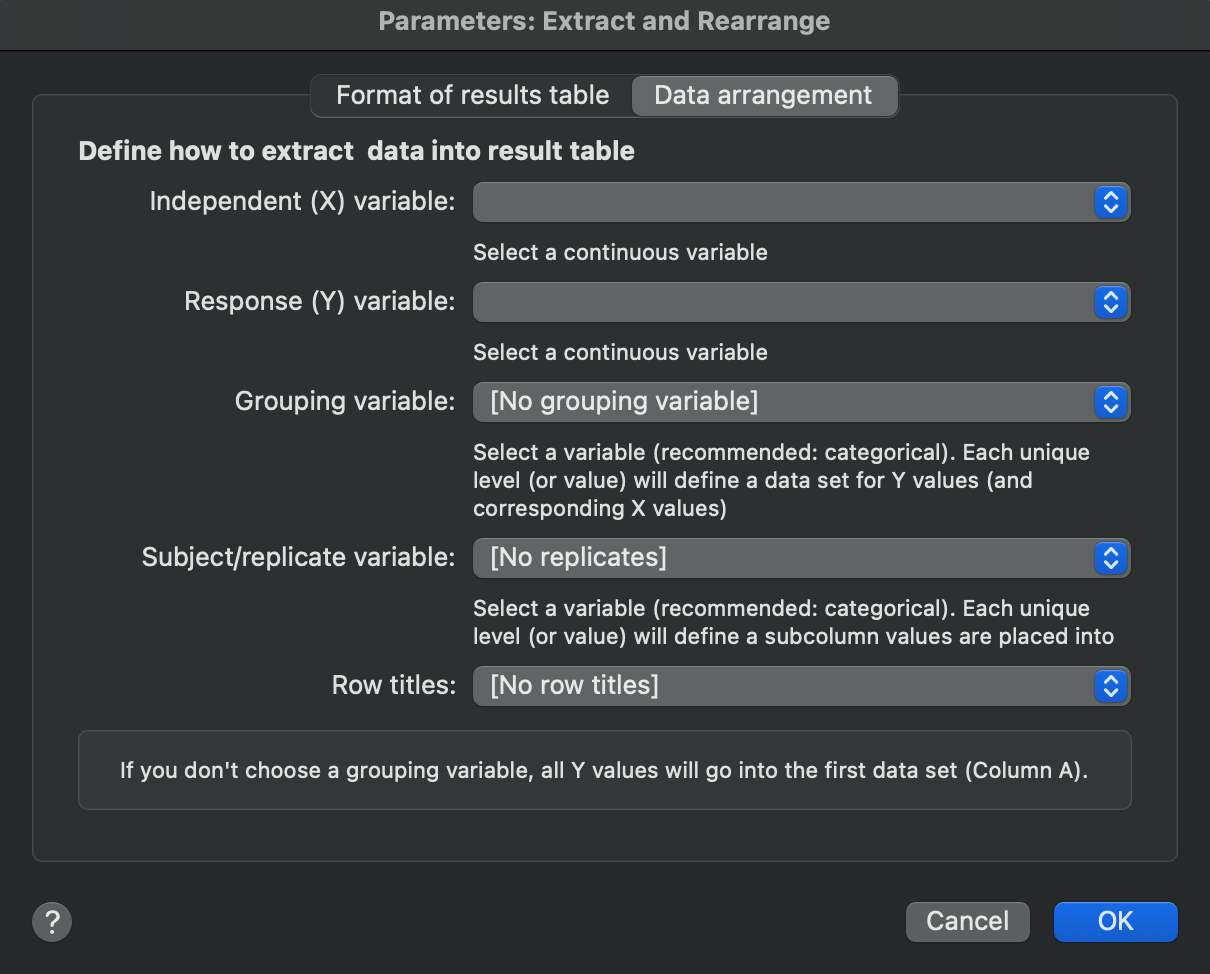
Data arrangement
On the second tab, define which variables to use to re-structure your data into the chosen table format.

XY Table
For creating an XY table, define:
•Independent (X) variable - The column that becomes the X values
•Response (Y) variable - The column containing the Y values
•Grouping variable - Defines which data set the Y values go into (integers only)
•Subject/replicate variable - Identifies replicates or subjects, and will determine which subcolumn the response values will be placed into
•Row titles - Optional column to provide row labels
Column Table
For creating a Column table, define:
•Response variable - The column with all the values that will go into the new column
•Grouping variable - Defines the data sets (integers only)
•Subject variable - Identifies replicates or subjects, and will determine which subcolumn the response values will be placed into
•Row titles - Optional column to provide row labels
Grouped Table
For creating a Grouped table, define:
•Response variable - The column with all the values that will go into the new table
•Row factor variable - Defines which row each value goes into (integers only)
•Column factor variable - Defines which data set each value goes into (integers only)
•Subject variable - Identifies replicates or subjects, and will determine which subcolumn the response values will be placed into
Contingency Table
For creating a Contingency table, define:
•Column (outcome) variable - Defines the outcomes (columns). Each unique level (or value) will become a column that is incremented
•Row (treatment) variable - Defines the exposure or treatment (rows). Each unique level (or value) will become a row that is incremented
•Count variable - Optional column that defines how large an increment to make for each cell. Negative or non-integer values in this variable will not be used to tabulate the count results
None of the values in the input table go directly into the new contingency table. Rather, the new table is a cross-tabulation table. Normally each row in the input table will increment one particular cell (defined by row and column) in the created table. Optionally, you can define the count variable that specifies the increment amount.
Swapping X and Y variables
Note: If your goal is to swap X and Y values on a XY table, this analysis won't let you do it. Use the Transform analysis instead. It has a choice to swap X and Y.