Features and functionality described on this page are available with our new Pro and Enterprise plans. Learn More... |
Prism's Multiple Variables tables now support in-table variable formulas, letting you create new calculated variables by writing functions or transforms that reference other variables in the same table. If you've used calculated columns in Excel or Google Sheets, this will feel familiar, but with some important differences that make these transforms more reliable and easier to maintain.
Unlike spreadsheet formulas that reference specific cell ranges, Prism's formulas work on entire variables at once. You define how to calculate the variable values using a formula definition, and Prism applies that formula to every row automatically. This database-style approach means the values of your calculated variables update automatically when you add, remove, or modify data, and you never have to worry about remembering to copy formulas down.
When to Use In-table Formulas
In-table formulas are ideal when you need to derive new variables from existing data before analysis. Common applications include converting units (such as transforming height in inches to height in centimeters), calculating ratios between measurements (like waist-to-hip ratio), applying mathematical transformations for statistical analysis (such as log transformations for skewed data), or computing derived values from raw measurements (like body mass index from height and weight).
The calculated variables you define become part of your data table's structure. When you update the source data, all calculated values recalculate automatically. This makes in-table variable formulas particularly valuable when you're receiving data in periodic batches or need to maintain a consistent set of derived variables across multiple projects.
The Data Inspector Panel
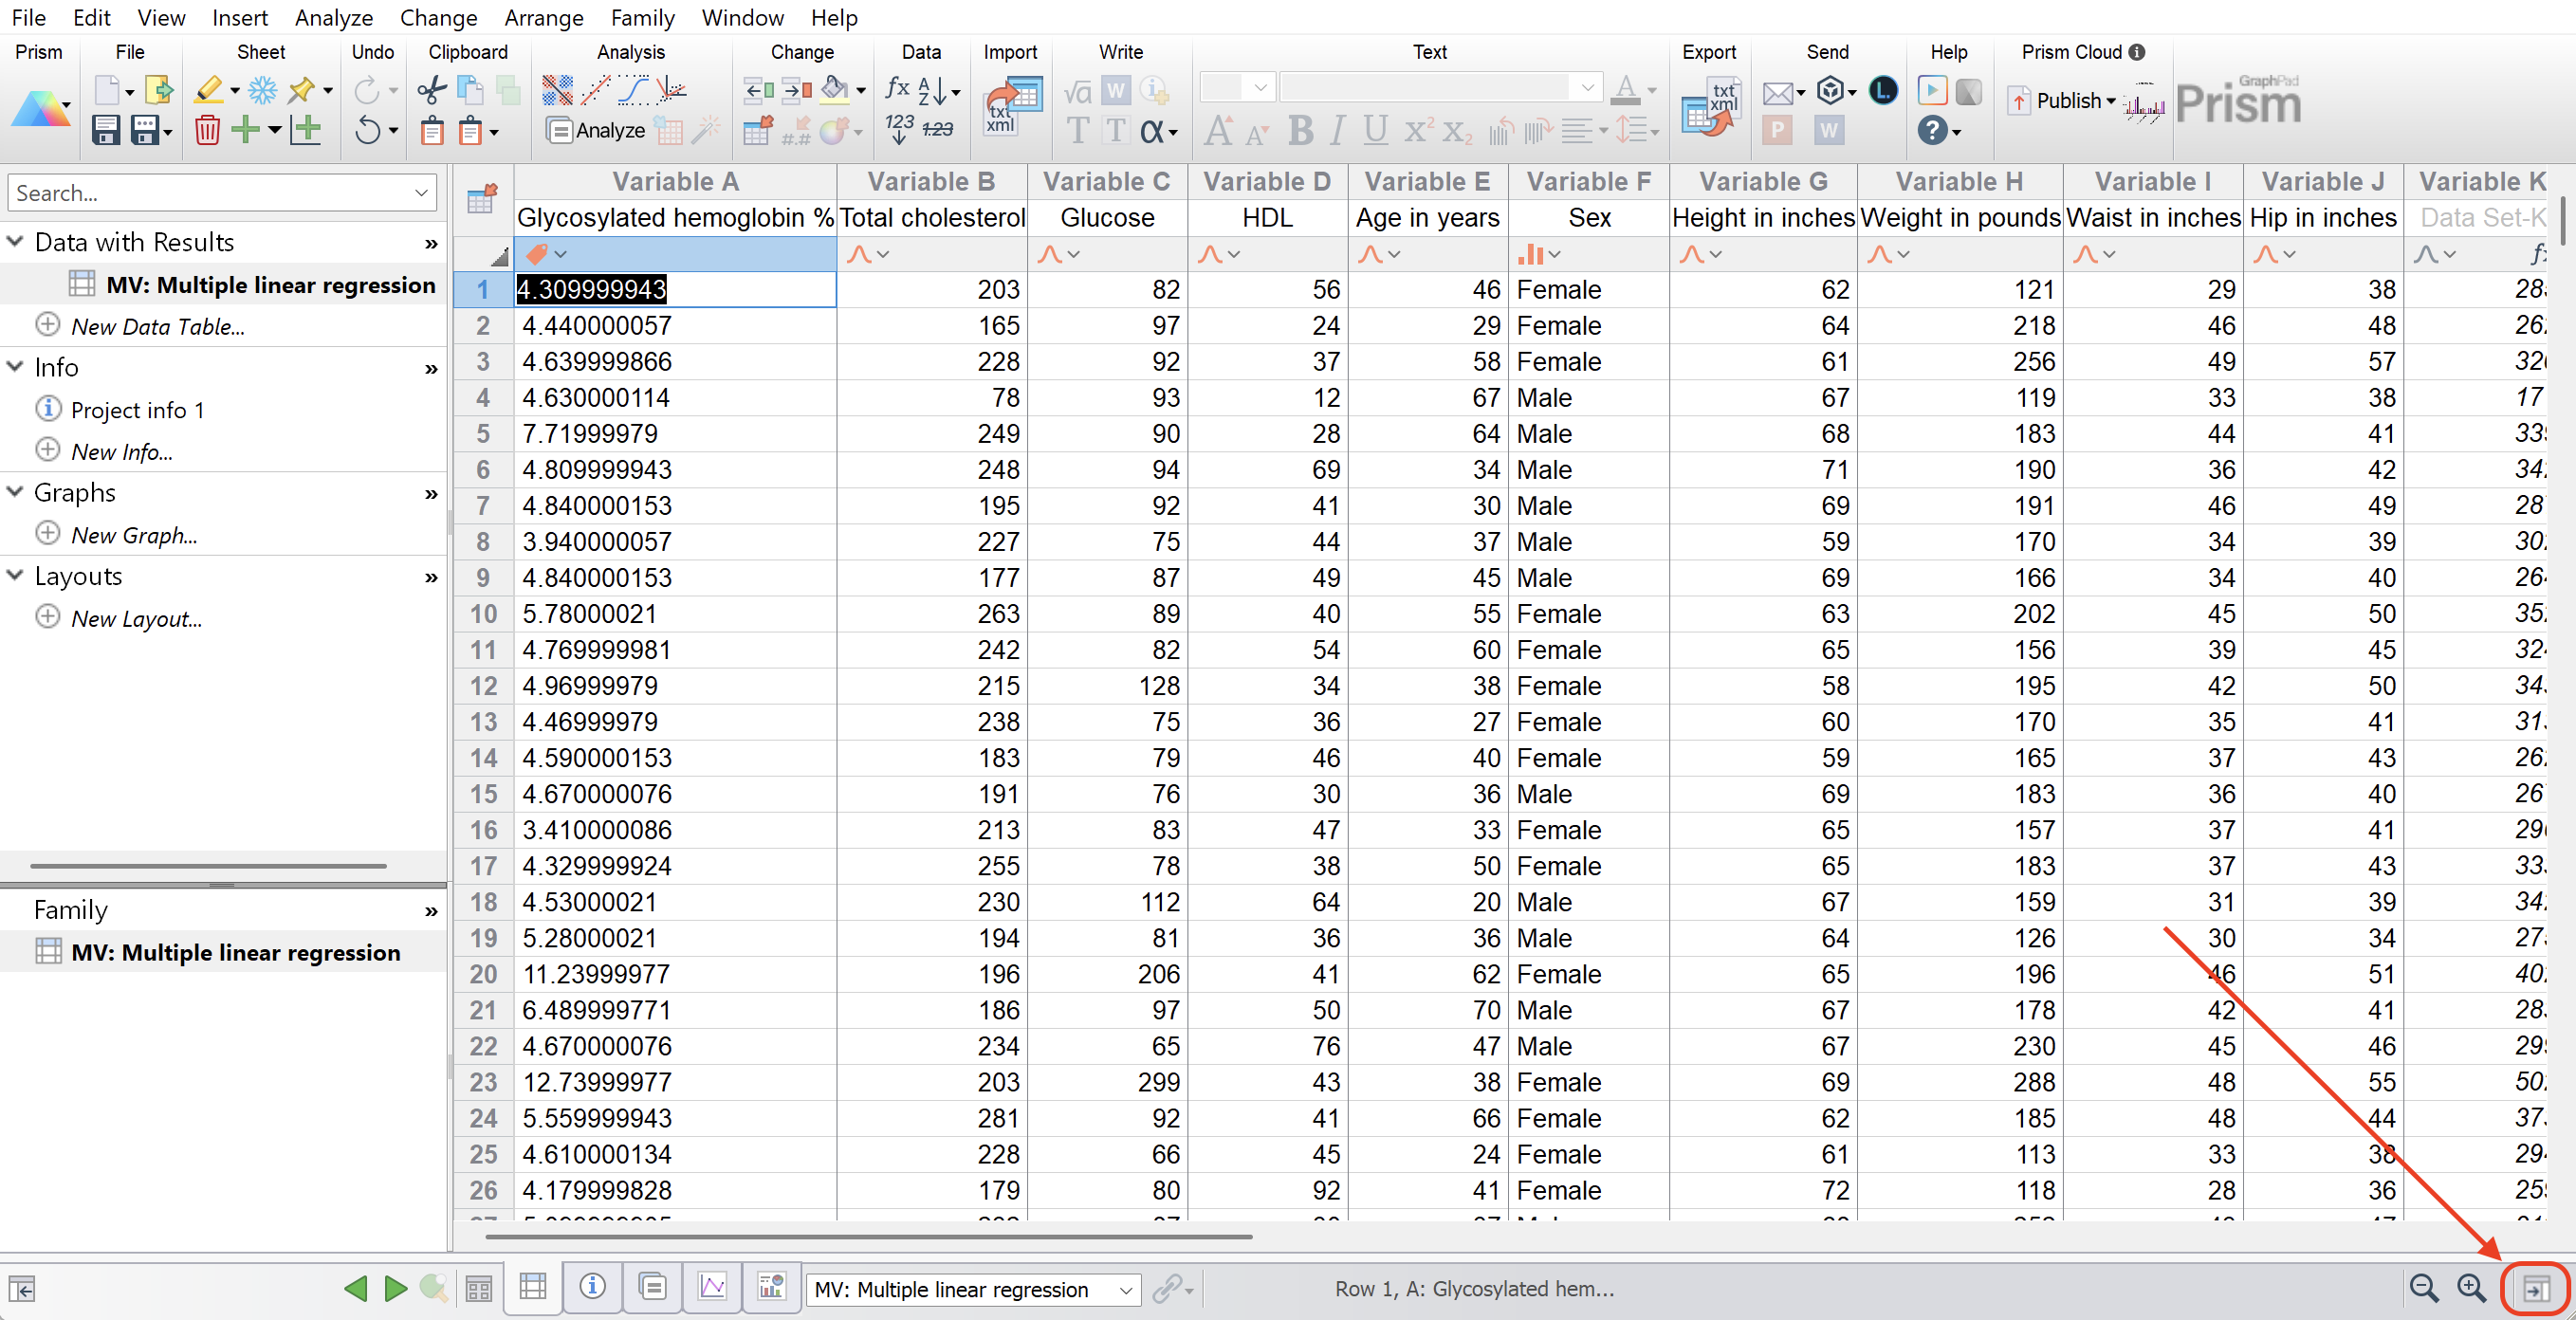
When you're working with a Multiple Variables data table, you'll see the Data Inspector panel on the right side of the window. If it isn't displayed, you can open it by simply clicking on the Display/Hide Inspector Panel toggle button at the bottom right or the Prism window.
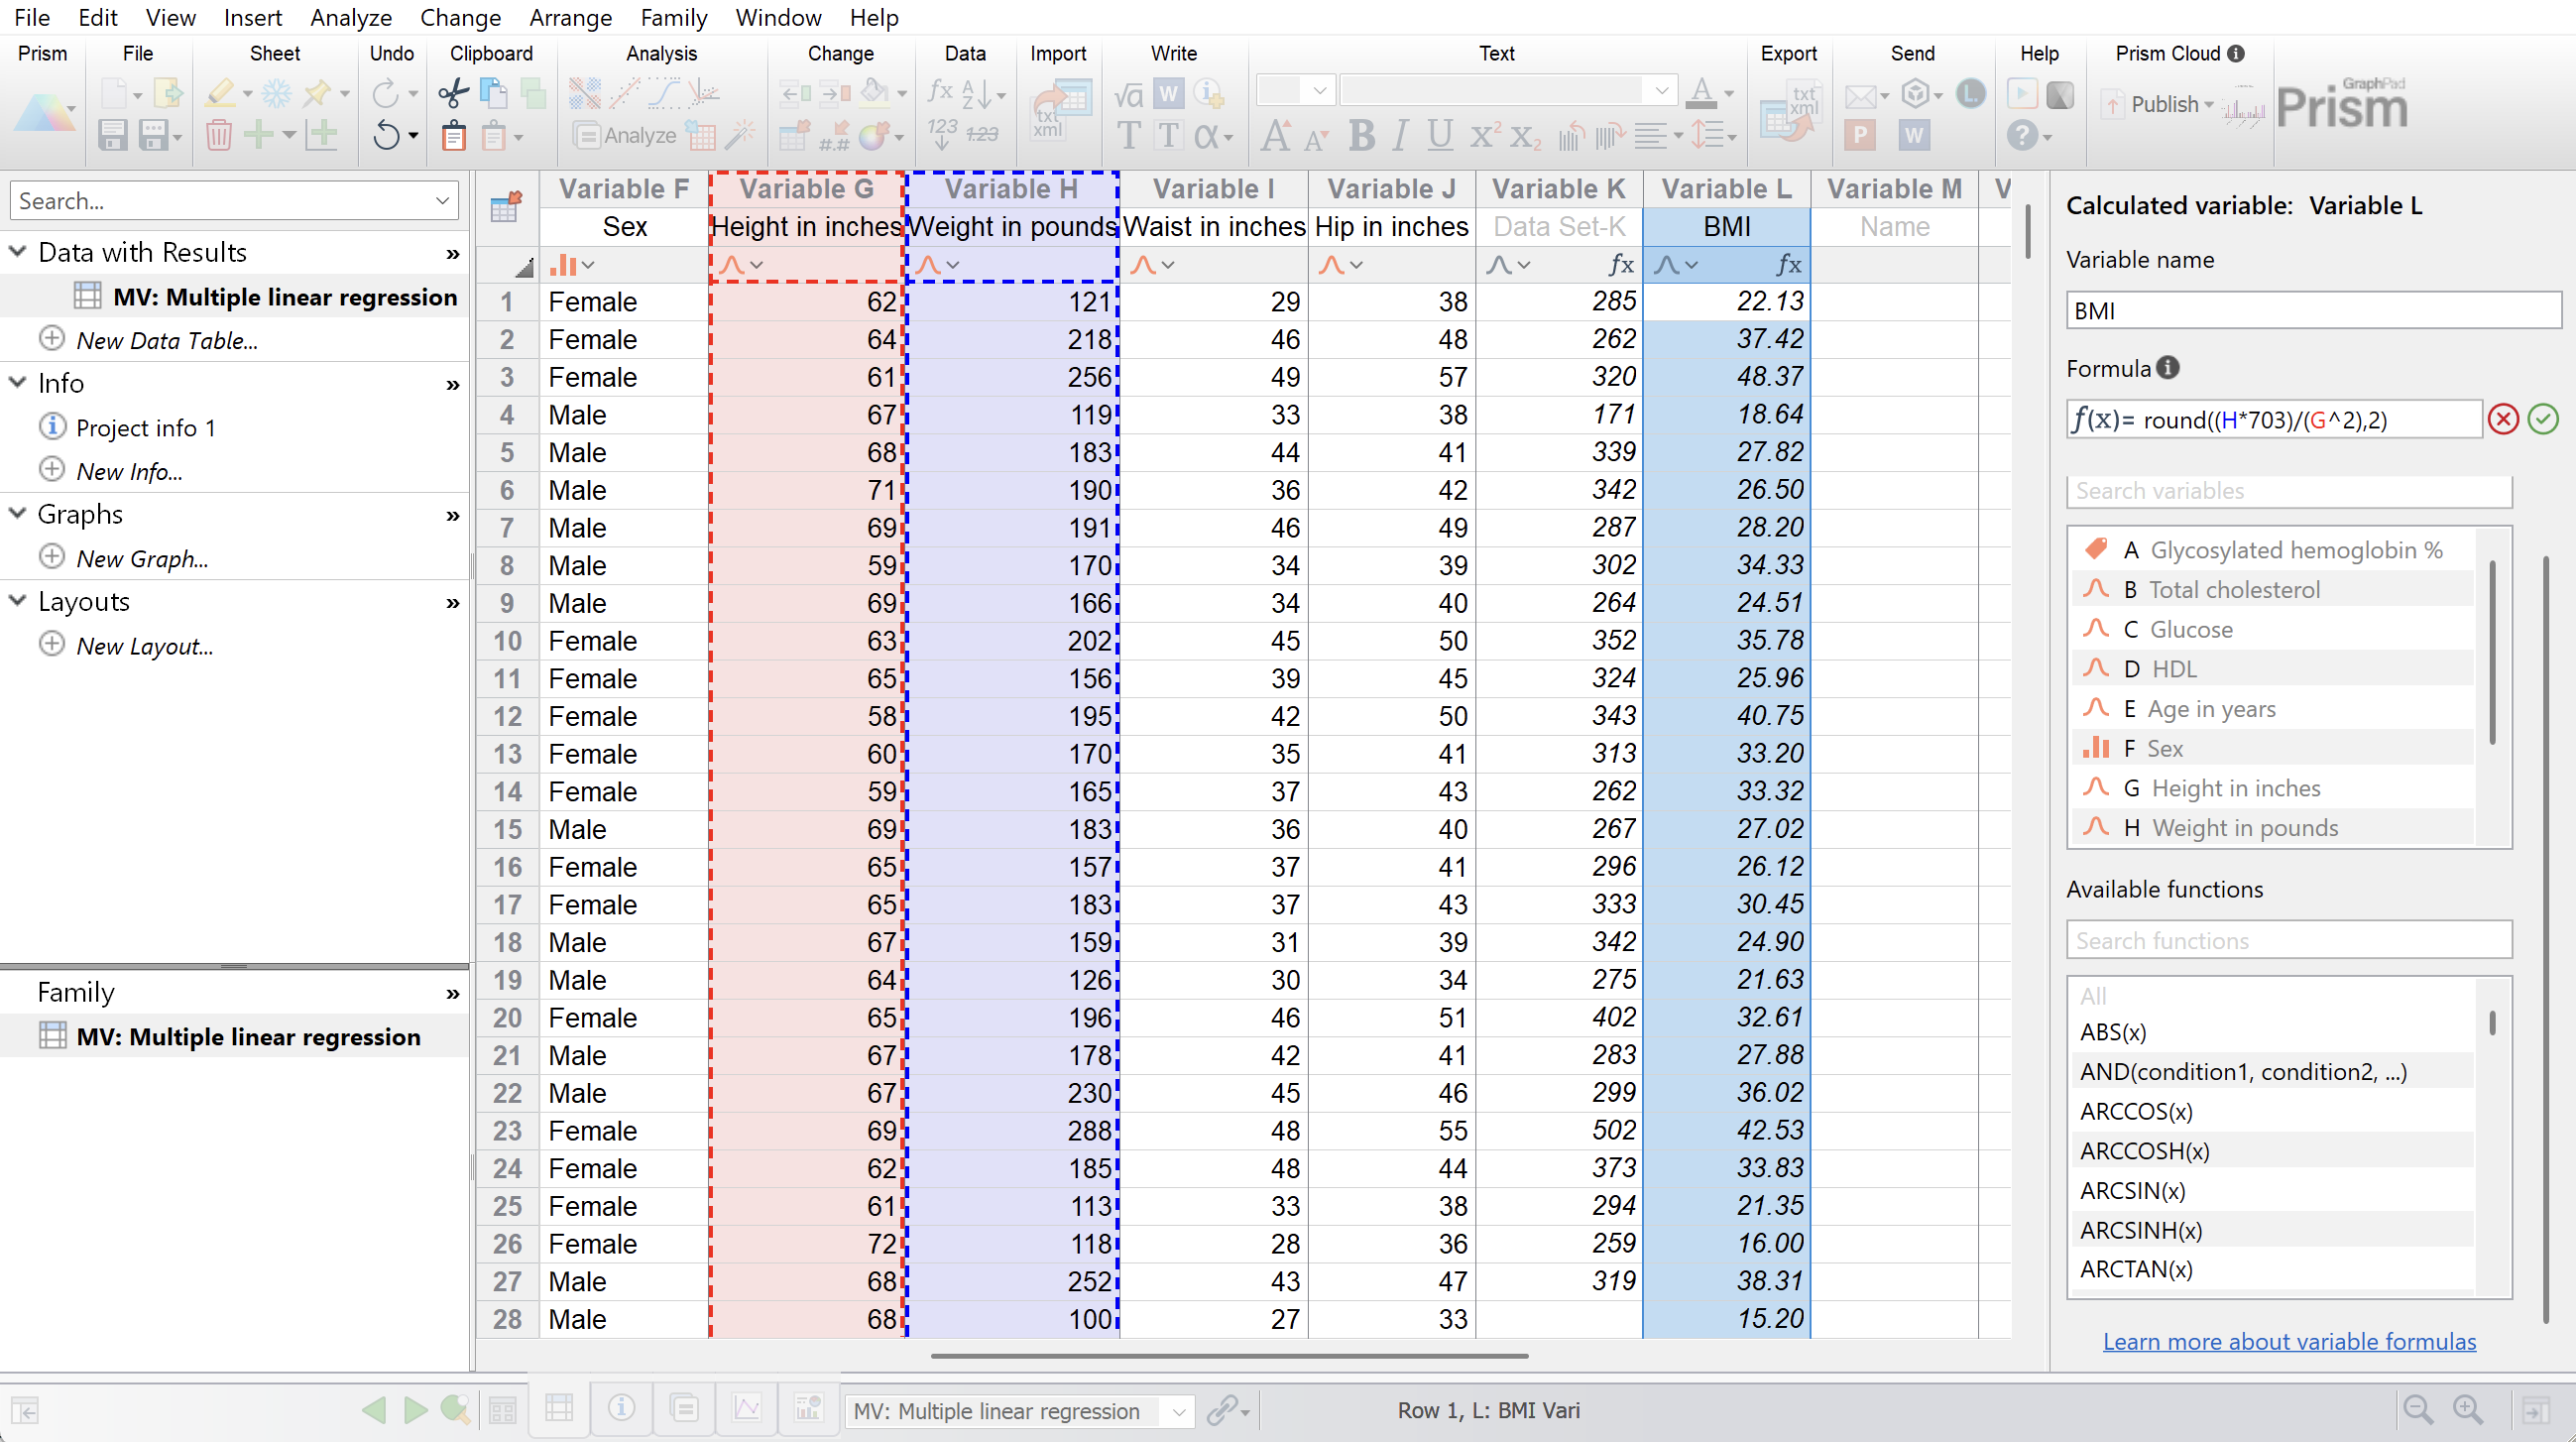
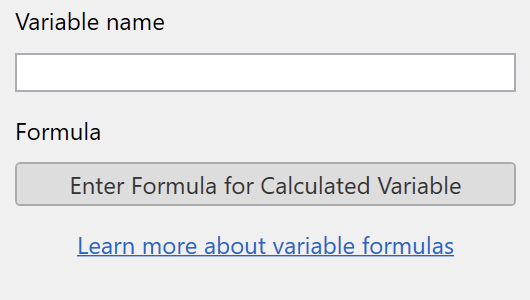
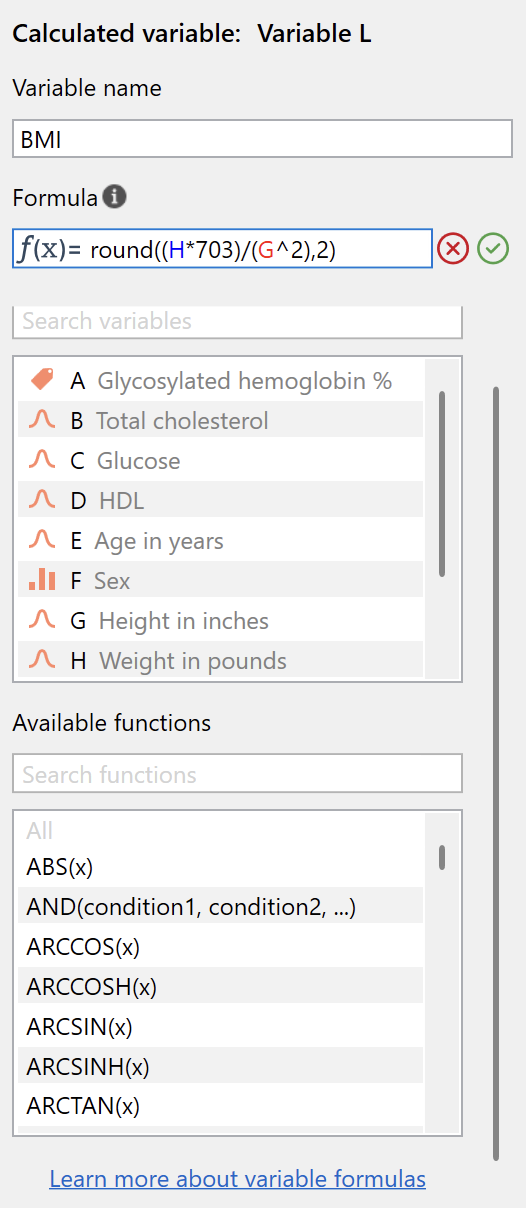
When you select a variable in the table, the Data Inspector displays the variable name along with a button labeled "Enter Formula for Calculated Variable." The variable name field lets you rename the variable right from the inspector. This is handy when you're setting up several new transformed variables in sequence.
Note that you're able to click the "Enter Formula for Calculated Variable" button after selecting a variable that already has data in it. But since this would result in clearing the values currently in the table, Prism will display an alert to make sure you want to continue first.
Creating a Calculated Variable
To create a calculated variable with an in-table formula, you have several options. The most straightforward is to select an empty variable in the data table where you want to output the calculated values, and click "Enter Formula for Calculated Variable" in the Data Inspector panel. Alternatively, you can click directly on the variable in the data table and press the equals sign (=) key. This keyboard shortcut immediately opens the formula definition view, letting you start typing your formula without any additional clicks. It's the fastest way to work once you're comfortable with the feature, and it mirrors the behavior that you're likely familiar with from Excel or Google Sheets.
If you select a variable that already contains data, Prism will alert you before creating the new calculated variable. This safeguard prevents you from accidentally overwriting manually entered data. If you want to proceed anyway, you can confirm that you want to replace the existing values with calculated results.
The Formula Definition View
When you choose to create or edit a formula for a calculated variable, the Data Inspector switches to formula definition mode. At the top, you'll see the variable name field, which works the same way it does in the standard inspector view. Below that is the formula definition field which determines how values should be calculated.
The formula definition field accepts formulas using standard mathematical notation. You can reference other variables by their letter designation (A, B, C, and so on), use arithmetic operators like addition, subtraction, multiplication, and division, and call functions from Prism's function library.
Referencing Variables
Below the formula definition field, you'll find the "Available variables" section. This lists every variable in your data table except the one you're currently defining. Each variable is shown with its letter designation (how you reference it in formulas), its type (Continuous or Categorical), and its name. The letter is what matters for formulas. You'll write something like "A + B" or "COS(C)" rather than using the variable names.
The variable list includes a search field at the top, which can be used to filter by variable name. This is particularly helpful in tables with many variables where you need to find a specific measurement. Once you locate the variable you need, you can double click it to add it to the formula definition.
Using Functions
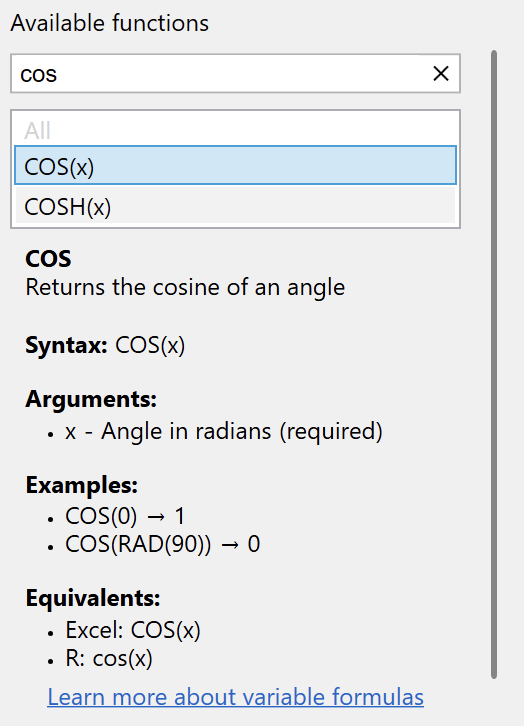
The "Available functions" section shows all the mathematical and statistical functions you can incorporate into your transforms. The list is alphabetically organized and includes everything from basic operations like absolute value and square root to trigonometric functions, logarithms, and conditional logic.
When you click on a function in the list, the section expands to show comprehensive documentation about that function. You'll see a description of what the function does, its syntax showing exactly how to write it, the arguments it requires, practical examples demonstrating its use, and equivalent functions in Excel and R for users familiar with those environments. This inline documentation means you rarely need to leave the transform definition view to look up how a function works.
For example, if you click on COS(x), you'll see that it returns the cosine of an angle, requires one argument (the angle in radians), and includes examples showing COS(0) equals 1 and COS(RAD(90)) equals 0. The documentation also notes that it's equivalent to COS(x) in Excel and cos(x) in R.
Writing Formulas for Created Variables
Formulas defining calculated variables follow mathematical conventions that should feel natural if you've written spreadsheet formulas before. You can use standard operators including + for addition, - for subtraction, * for multiplication, / for division, and ^ for exponentiation. Parentheses control the order of operations just as they do in algebra.
A simple transform might look like "A * 2.54" to convert inches to centimeters, or "A / B" to calculate a ratio. More complex transforms can chain multiple operations and functions together: "LOG(A) + SQRT(B)" or "IF(A > 100, A/100, A)" for conditional calculations. The key is that your formula operates on entire variables row by row. Prism applies whatever calculation you define to each row's values automatically.
Examples of Common Transforms
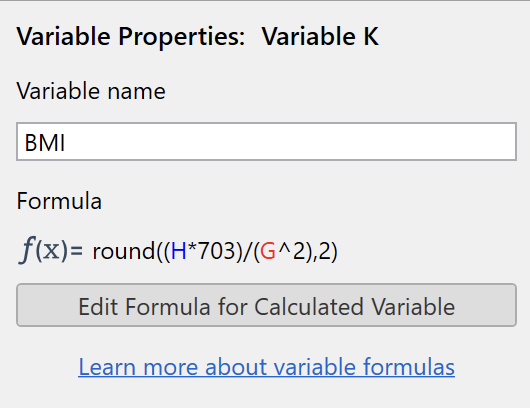
Unit conversions are straightforward. To convert height from inches (variable G) to centimeters, you'd write "G * 2.54". To convert weight from pounds (variable H) to kilograms, you'd write "H / 2.205". You can also combine conversions with additional calculations, such as computing body mass index from height in inches and weight in pounds: "H / 2.205 / ((G * 2.54 / 100) ^ 2)".
Ratio calculations are equally simple. If variable A contains waist circumference and variable B contains hip circumference, the waist-to-hip ratio is just "A / B". For more complex ratios that might involve sums or differences, you'd write something like "(A - B) / (A + B)" to calculate a normalized difference.
Mathematical transformations for statistical analyses often use functions. To create a log-transformed version of variable C, you might write "LOG(C)" for the base-10 logarithm or "LN(C)" for the natural logarithm. To apply a square root transformation to variable D, you'd write "SQRT(D)". For inverse transformations, you can write "1/E" or use exponentiation like "E^(-1)".
Conditional calculations use the IF function. The syntax is "IF(condition, value_if_true, value_if_false)". For instance, to cap values at 100, you'd write "IF(A > 100, 100, A)". In text, this would read "If the value A is greater than 100, return the value 100, otherwise return the value of A." To categorize continuous values, you might write "IF(A < 50, "Low", "High")" to create a binary categorical variable. You can also nest IF functions for more categories: "IF(A < 50, "Low", IF(A < 75, "Medium", "High"))" creates three categories.
Committing and Applying Formulas
Once you've written your formula in the definition field, you commit it by pressing the Enter key or clicking the checkmark button to the right of the field. Prism immediately applies the formula to every row in the table, calculating values according to your definition. If there are any issues with your formula - such as referencing a variable that doesn't exist or using a function incorrectly - Prism will alert you with an error message rather than committing the formula.
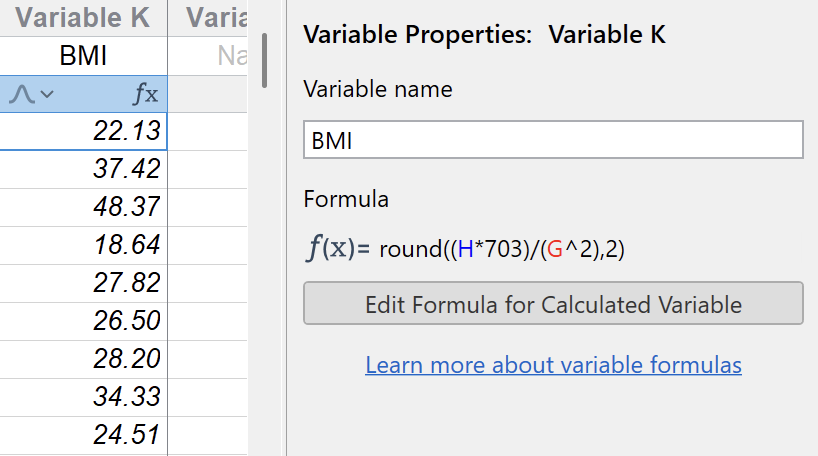
After the formula is committed, you'll see the calculated values appear in the data table. These values are displayed in italics, which distinguishes them from manually entered data at a glance. The italic formatting makes it immediately clear which columns contain calculated results and which contain your original observations.
The formula is now part of the variable's definition. If you edit values in any of the source variables referenced by the formula, the values of the calculated variable update automatically. If you add new rows to the table, the formula applies to those rows as well. This automatic updating is one of the key advantages over copying calculated values: your derived variables always stay synchronized with your source data.
Editing Existing Formulas
You can return to the formula definition at any time to modify the formula. When you select a variable that has a transform, the Data Inspector shows "Edit Formula for Calculated Variable" instead of "Enter Formula for Calculated Variable". Clicking this button takes you back to the formula definition view where you can modify the formula.
There are two additional ways to access the formula definition for an existing transform. You can click the small "fx" icon that appears at the top of any variable that has a transform defined. This icon serves as a visual indicator that the variable contains calculated values and provides quick access to the formula. You can also click on any value in the variable and press the equals sign (=) key, just as you would to create a new transform. This shortcut works whether you're creating or editing a transform, making it a universal way to access the definition view.
When you modify a transform formula, Prism recalculates all values immediately after you commit the change. There's no need to manually refresh or recalculate. The updates happen automatically as soon as you press Enter or click the checkmark.
Handling Errors
When something goes wrong with a calculated variable or formula, Prism provides clear visual feedback. Variables with errors are highlighted in red in the data table, making them impossible to miss. At the top of the variable, you'll see a yellow caution symbol next to the variable name. And in the Data Inspector panel, Prism displays a specific error message explaining what went wrong.
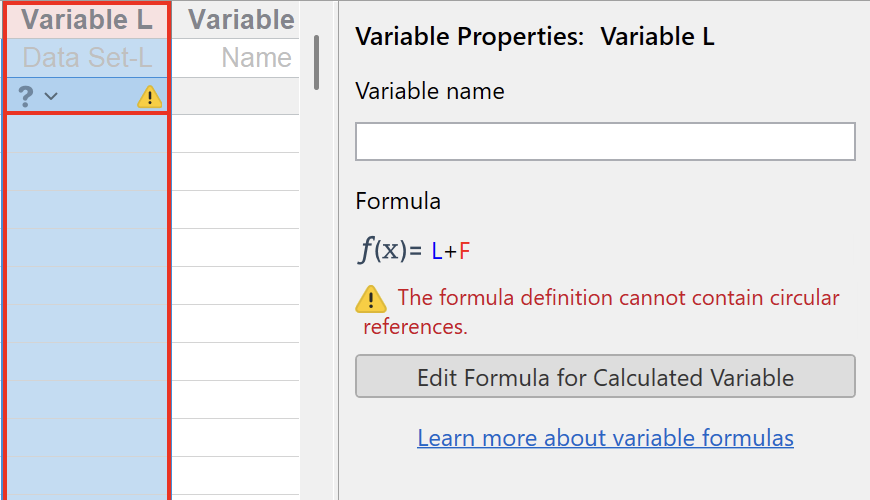
Common errors include referencing variables with no data (such as using "Z" in a formula when your table only has variables A through R), creating circular references (where a variable's formula references itself, directly or indirectly), using functions incorrectly (such as providing the wrong number of arguments), and referencing variables that have been deleted. Each of these situations produces a clear error message that helps you identify and fix the problem.
Circular references deserve special attention because they can be subtle. A direct circular reference is obvious: variable L's formula can't reference L itself. But indirect circular references can occur when L references M, M references N, and N references L. Prism detects these circular dependencies and flags them with an error message, preventing infinite calculation loops.
When you delete a variable that other formulas depend on, Prism doesn't delete those dependent formulas automatically. Instead, it marks them as having errors. This gives you the opportunity to either fix the formulas to reference different variables or remove the formulas entirely if they're no longer needed. This approach prevents data loss - if you accidentally deleted a variable, you can undo the deletion and the dependent formulas will immediately start working again.
Values of Calculated Variables from Formulas Versus Manual Data
It's important to understand that a variable can contain either manual data or calculated data, but not both. When you define a formula for a variable, that variable becomes entirely calculated. You can't directly edit individual cells within it. The only way to change the values is to modify the formula or change the values in the source variables that the transform references.
This restriction is actually a feature rather than a limitation. It prevents the ambiguous situations that can arise in spreadsheets where some cells contain formulas and others contain manual edits, making it unclear whether a value is calculated or hand-entered. In Prism, if you see italic text, you know it's calculated. If you don't, it's manual. There's no ambiguity.
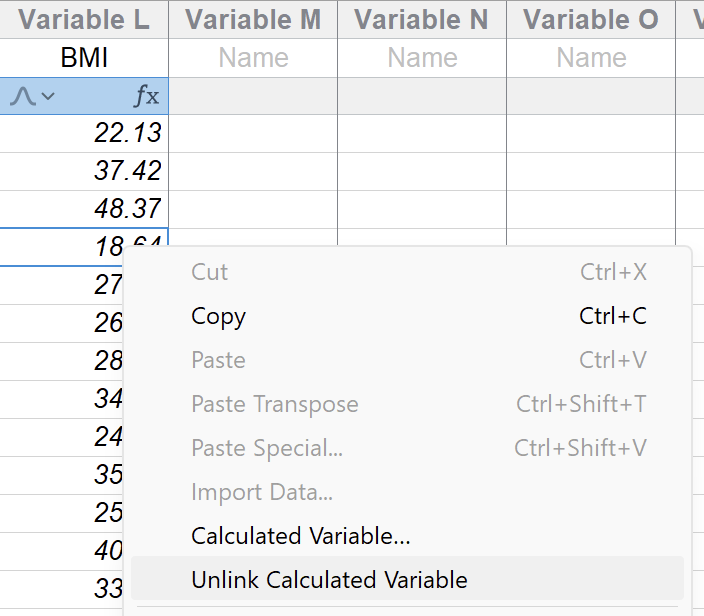
If you need to convert calculated values to manual data (perhaps because you want to lock in the current calculated values or because you need to make manual adjustments) you can remove the formula without removing the values. To do this, simply right click on the variable and select "Unlink calculated variable". This gives you an easy way to "freeze" a calculated variable when needed while preserving your work.
Best Practices
As you work with in-table formulas, a few practices will help you maintain clear, reliable analyses. First, use descriptive variable names. When you have multiple related variables such as height in inches, height in centimeters, and height in meters, clear names make it obvious which is which. "Height_in", "Height_cm", and "Height_m" help remove any ambiguity between the variables.
Second, keep formulas simple when possible. While you can write complex formulas with nested functions and multiple operations, simpler formulas are easier to understand and verify. If you find yourself writing a very complex formula, consider whether you could break it into multiple intermediate formula definitions. For example, instead of one formula that calculates BMI directly from height in inches and weight in pounds, you might create separate formulas to calculate height in meters and weight in kilograms, then calculate BMI from those. The final result is the same, but the intermediate steps are easier to verify.
Finally, verify your formulas with a few test cases. After using a formula to generate a calculated variable, manually calculate what you expect for a few rows and check that Prism's calculated values match. This catches formula errors before they affect your entire analysis. It's especially important when creating complex formulas or when working with data where errors could have significant consequences.
Transforms and Analysis
Transformed variables work just like any other variable in your Multiple Variables table. You can use them as independent variables, dependent variables, or grouping variables in any analysis that works with Multiple Variables tables. Prism doesn't distinguish between manually entered data and calculated data when you're setting up an analysis, they're both just variables.
This means you can create transformed variables specifically for analysis without cluttering your original data. Need log-transformed data for a t test? Use a formula to generate a calculated variable. Want to analyze both raw and normalized values? Create both variables and run separate analyses. The flexibility to generate derived variables on the fly, without modifying your original data or maintaining separate spreadsheets, streamlines your analytical workflow.
When you share a project file or export results, the formula definitions are included. Anyone who opens your project file will see the same calculated values, and the formulas will be visible in the Data Inspector. This ensures that your analytical pipeline is transparent and reproducible. Other users can see exactly how you derived your variables and modify the formulas if needed.