In many situations, it may make sense to include analysis results that Prism has generated on the same graph or layout sheet that contains the graph/visualization associated with the analysis. This can help in preparing figures or presentations so that all of the most important information is presented in one location.
Add a (formatted) table of results generated by Prism
When Prism performs analyses, it generates one or more results sheet to provide the analysis results. These results sheets may be formatted simply for presentation of the results and cannot be analyzed further (results sheets with red grid lines). While others may adopt one of Prism's structured table formats (XY, Column, Grouped, etc.) and allow for further analysis (results sheets with green grid lines). In either case, it's possible to add these results to a graph or layout quite easily:
1.Select a cell or a range of cells on a results table (or data table).
2.Copy to the clipboard.
3.Go to a graph and layout and paste.
4.Double click to reformat.
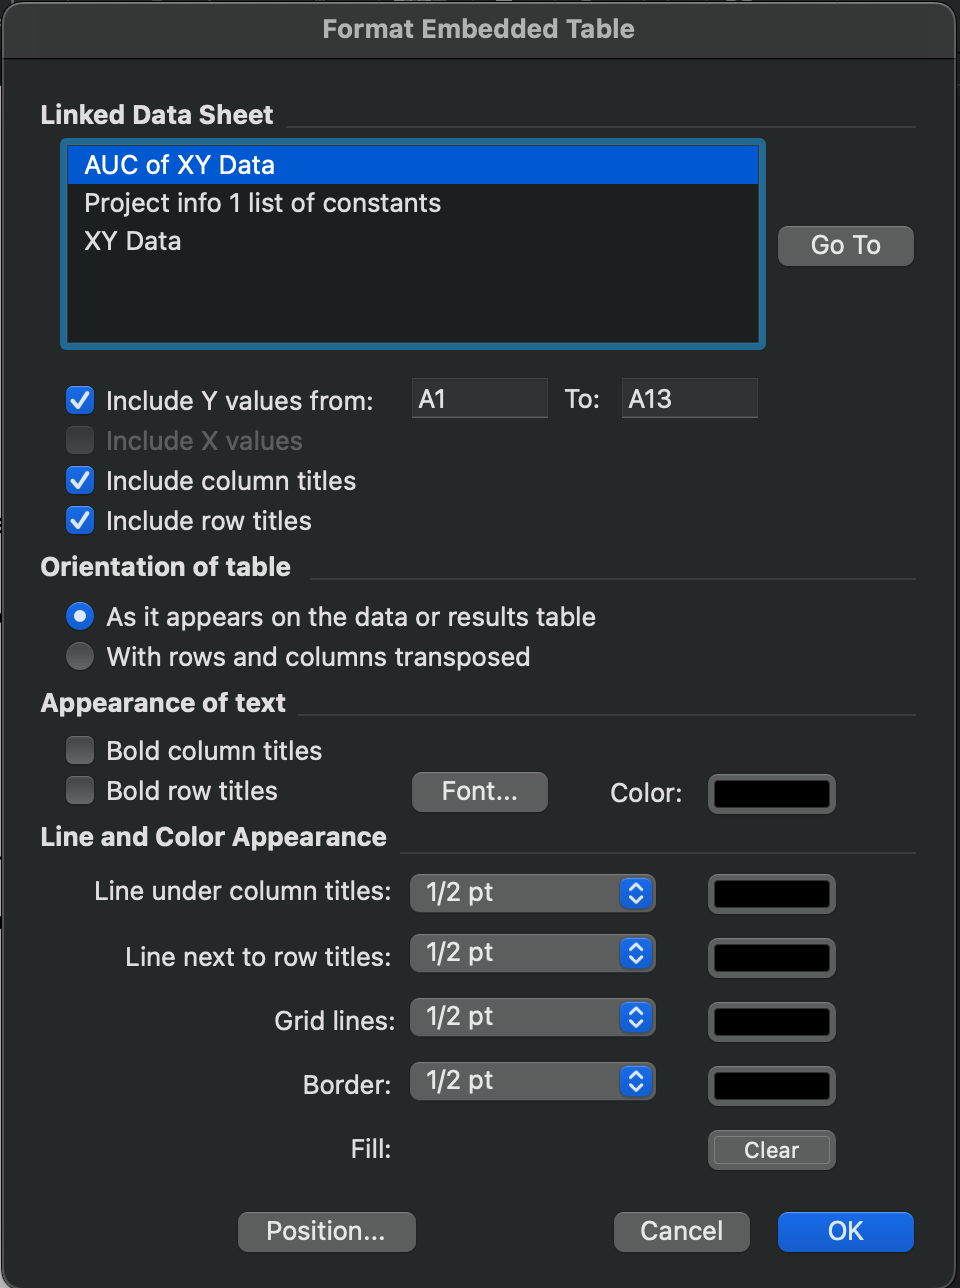
Insert an analysis constant or info constant (Hook constant)
Each Prism analysis involves a number of various analysis constants that define both the inputs (parameters) and the outputs (results) of the analysis. These constants are specific to the analysis performed, and many are made available through the Hook Constant dialog. For example, after performing nonlinear regression, the Hook Constant dialog can provide constants such as the best-fit estimates for the model parameters, the number of X and Y values analyzed from the data, or various goodness-of-fit metrics like R2 and others.
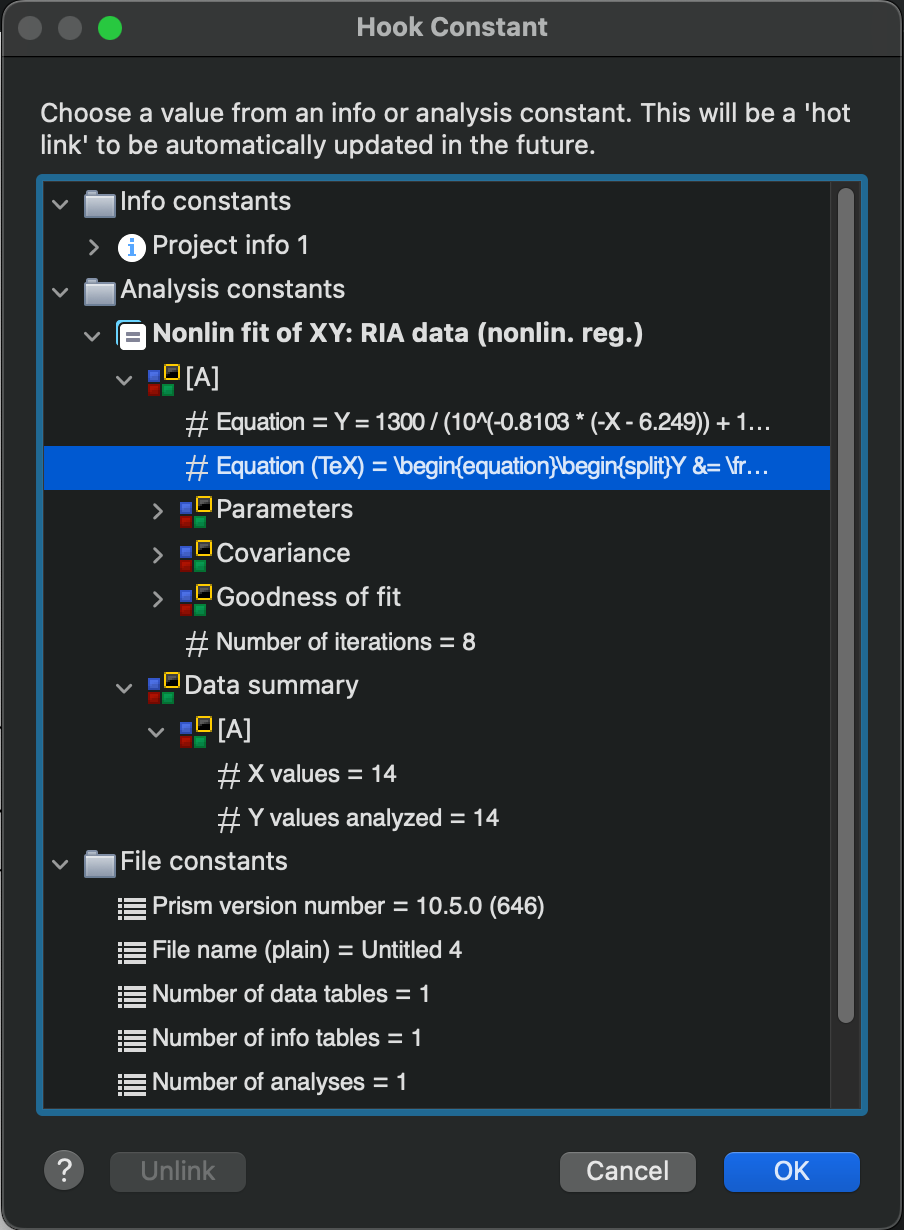
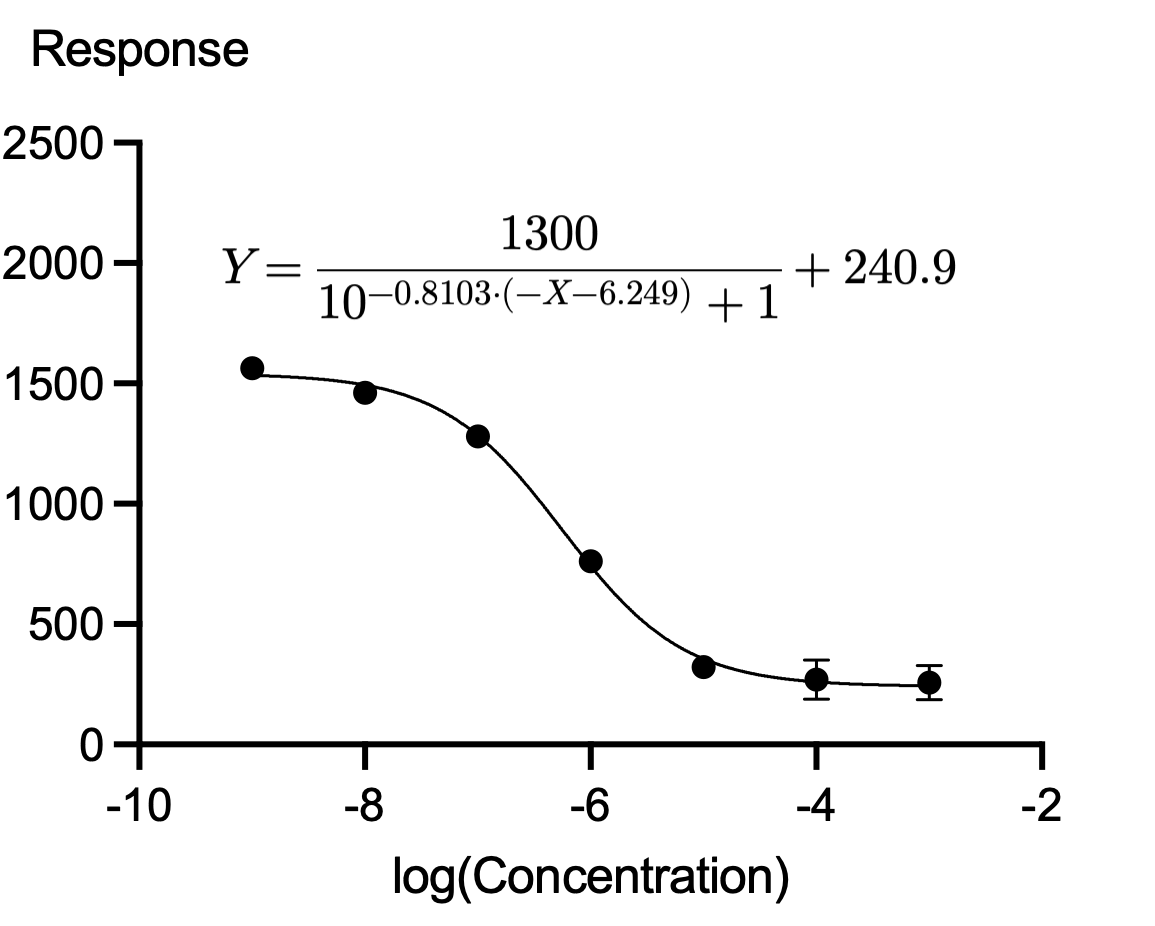
You're even able to access a TeX version of the nonlinear regression model with best-fit parameter estimates for a visually appealing presentation of the formula of the best-fit curve.
To access the Hook Constant dialog, simply open the graph or layout sheet where you'd like to add the constant. Then either:
•Click the "Insert info or analysis constant" button in the "Write" section of the toolbar (the icon is a white circle with a blue "i" and a yellow "+" symbol)
•Open the Insert menu and select "Insert info or analysis constant..."
A separate page in this guide provides additional information on using the Hook Constant dialog and some other ways that this functionality can be leveraged in Prism.