There are two help screens for the Options tab for the two-way ANOVA dialog:
•A different page explains the multiple comparisons options.
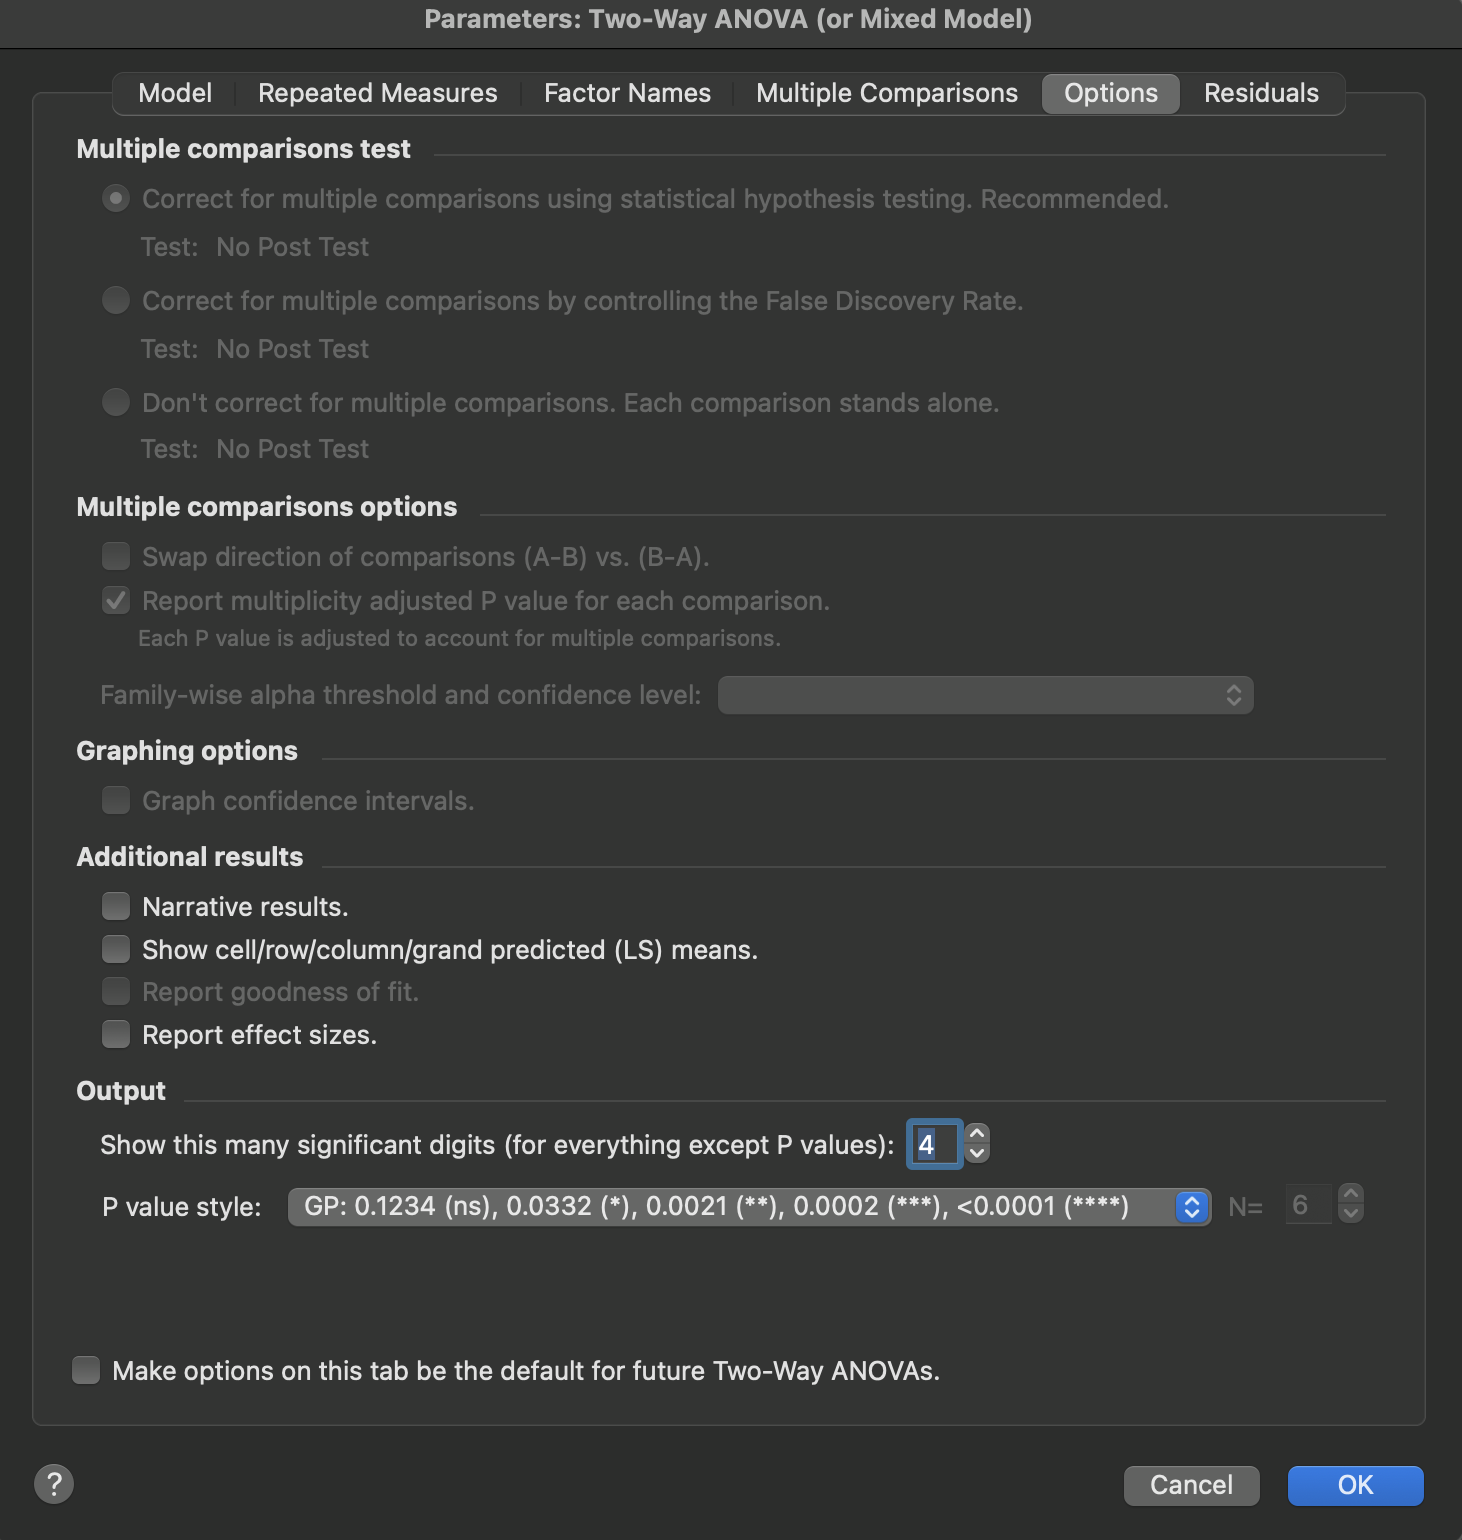
•This page explains the graphing and output options.
Graphing options
If you chose a multiple comparison method that computes confidence intervals (Tukey, Dunnett, etc.) Prism can plot these confidence intervals. This is a great way to show the key results of ANOVA. Consider showing a graph like this with your results.

Additional results
•Report the results in paragraph (narrative) form, as well as the usual tabular results. This is not available when you fit a mixed model.
•Create a table of means showing the mean (or predicted LS mean if there are missing values) for each cell, as well as for each row and column, and grand means.
Effect sizes
Features and functionality described in this section are available with our new Pro and Enterprise plans. Learn More... |
Prism can calculate effect sizes for two-way ANOVA that quantify the magnitude of effects from each factor and their interaction. These measures help you understand not just whether effects are statistically significant, but how much of the variation in your data each factor explains. While some explanation is provided in the sections below, the page Understanding ANOVA Effect Sizes provides some additional details on the calculation and interpretation of standard effect sizes used in ANOVA. For two-way ANOVA, Prism reports effect sizes separately for each source of variation: the interaction, the row factor, and the column factor.
% of total variation
This is the most intuitive effect size, expressing what percentage of the total variability in your data is explained by each source. For example, if the row factor accounts for 46% of total variation, the column factor 28%, and their interaction 19%, this tells you that the row factor has the largest effect on your outcome variable. The remaining variation (about 7% in this example) represents unexplained within-group variability.
Eta-squared (η²) and partial eta-squared
Eta-squared is mathematically equivalent to "% of total variation" but expressed as a proportion (0 to 1) rather than a percentage. Partial eta-squared differs from eta-squared in how it's calculated: it represents the proportion of variance explained by each effect after removing variance due to other effects in the model. For two-way ANOVA, partial eta-squared is typically larger than eta-squared and is more commonly reported in the literature, particularly when comparing effect sizes across studies with different designs.
These values can be calculated from the ANOVA table with the following formulas:
Cohen's f
Cohen's f is derived from eta-squared and provides standardized benchmarks for interpreting the magnitude of each effect. Cohen suggested these guidelines:
•Small effect: f ≈ 0.10 (1% of variance explained)
•Medium effect: f ≈ 0.25 (6% of variance explained)
•Large effect: f ≈ 0.40 (14% of variance explained)
Cohen's f is particularly useful for power analysis when planning future experiments.
Cohen's f can be calculated from eta squared or partial eta squared using the following formulas:
The value for Cohen's f that Prism reports can be obtained using the formula above with partial eta squared.
Interpreting effect sizes in two-way ANOVA
When interpreting effect sizes from two-way ANOVA, pay attention to the relative magnitudes across sources of variation. A statistically significant interaction with a small effect size might be less scientifically meaningful than a large main effect, even if both are significant. The pattern of effect sizes can reveal which factors are most important in your experimental system and can help guide the design of follow-up studies. Effect sizes are especially valuable when the percentages of variation explained by different sources help you understand the relative importance of main effects versus interactions in your data.
Output
Choose how you want P values reported, and how many significant digits you need for the other results.