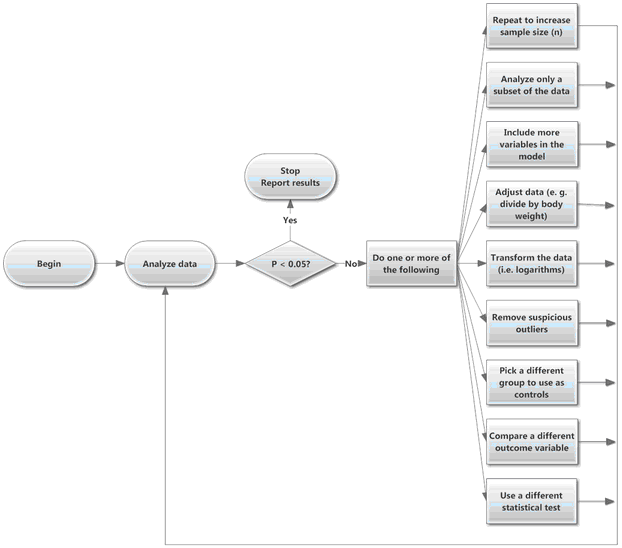
Statistical results can only be interpreted at face value when every choice in data analysis was performed exactly as planned and documented as part of the experimental design. This rule is commonly broken in some research fileds. Instead, analyses are often done as shown below:

Collect and analyze some data. If the results are not statistically significant but show a difference or trend in the direction you expected, collect some more data and reanalyze. Or try a different way to analyze the data: remove a few outliers; transform to logarithms; try a nonparametric test; redefine the outcome by normalizing (say, dividing by each animal’s weight); use a method to compare one variable while adjusting for differences in another; the list of possibilities is endless. Keep trying until you obtain a statistically significant result or until you run out of money, time, or curiosity.
The results from data collected this way cannot be interpreted at face value. Even if there really is no difference (or no effect), the chance of finding a “statistically significant” result exceeds 5%. The problem is that you introduce bias when you choose to collect more data (or analyze the data differently) only when the P value is greater than 0.05. If the P value was less than 0.05 in the first analysis, it might be larger than 0.05 after collecting more data or using an alternative analysis. But you’d never see this if you only collected more data or tried different data analysis strategies when the first P value was greater than 0.05.
The term P-hacking was coined by Simmons et al (1) who also use the phrase, “too many investigator degrees of freedom”. This is a general term that encompasses dynamic sample size collection, HARKing, and more. There are three kinds of P-hacking:
•The first kind of P-hacking involves changing the actual values analyzed. Examples include ad hoc sample size selection, switching to an alternate control group (if you don’t like the first results and your experiment involved two or more control groups), trying various combinations of independent variables to include in a multiple regression (whether the selection is manual or automatic), trying analyses with and without outliers, and analyzing various subgroups of the data.
•The second kind of P-hacking is reanalyzing a single data set with different statistical tests. Examples: Try parametric and nonparametric tests. Analyze the raw data, then try analyzing the logarithms of the data.
•The third kind of P-hacking is the garden of forking paths (2). This happens when researchers performed a reasonable analysis given their assumptions and their data, but would have done other analyses that were just as reasonable had the data turned out differently.
Exploring your data can be a very useful way to generate hypotheses and make preliminary conclusions. But all such analyses need to be clearly labeled, and then retested with new data.
Reference
1.Simmons, J. P., Nelson, L. D., & Simonsohn, U. (2011). False-positive psychology: undisclosed flexibility in data collection and analysis allows presenting anything as significant. Psychological Science, 22(11), 1359–1366.
2.Gelman, A., & Loken, E. (2013). The garden of forking paths: Why multiple comparisons can be a problem, even when there is no “fishing expedition” or ‘p-hacking’ and the research hypothesis was posited ahead of time. Unpublished as of Jan. 2016