Navigation: STATISTICS WITH PRISM 9 > Principal Component Analysis > Results of Principal Component Analysis > Primary Results
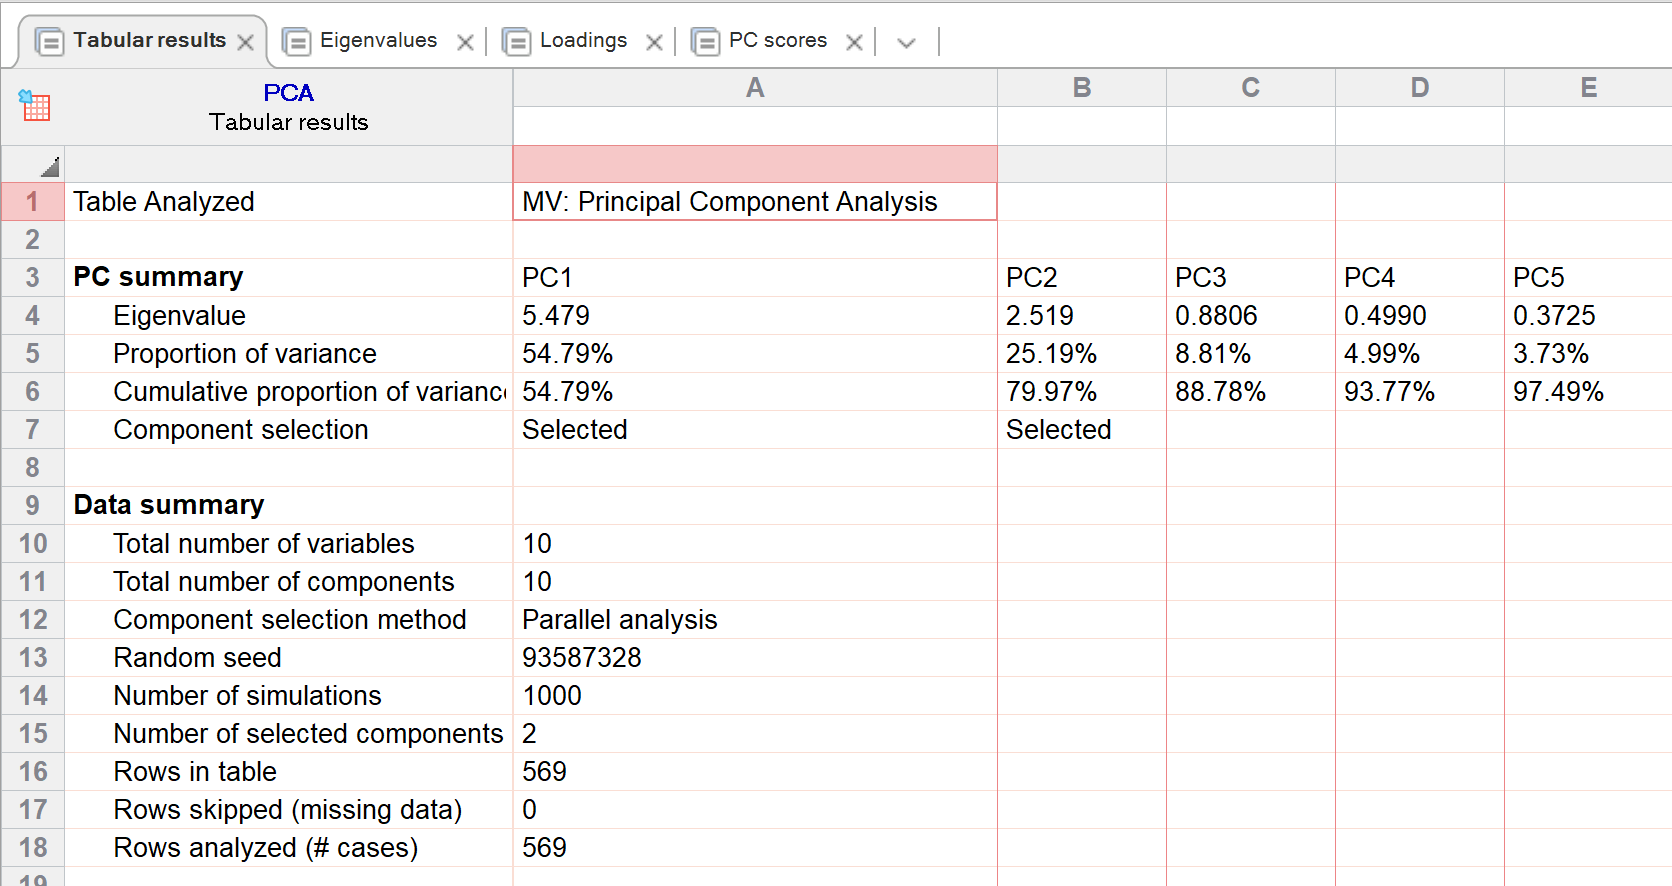
Tabular results
Tabular results provide a snapshot of the analysis, including the eigenvalues, proportion of variance explained, and the number of selected components. All Principal Components are included in this table even if only some components were selected.