A Prism project can contain a lot more than a single graph or data table. A Prism project (file) has five sections. Each can contain up to 500 pages (also called sheets):
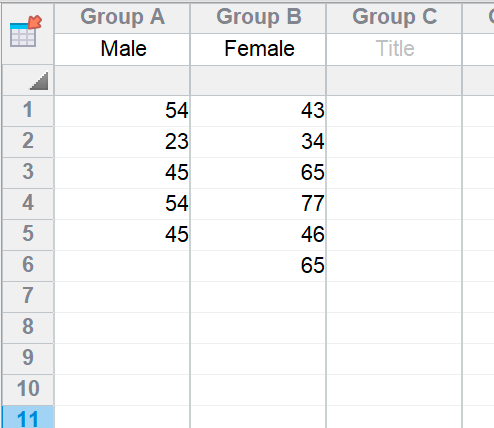
Enter and organize your data for analyses or graphs. Learn more.

|
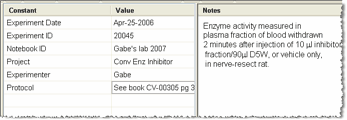
Keep a record of experimental details, or of constants you want to use in analyses. Learn more.

|
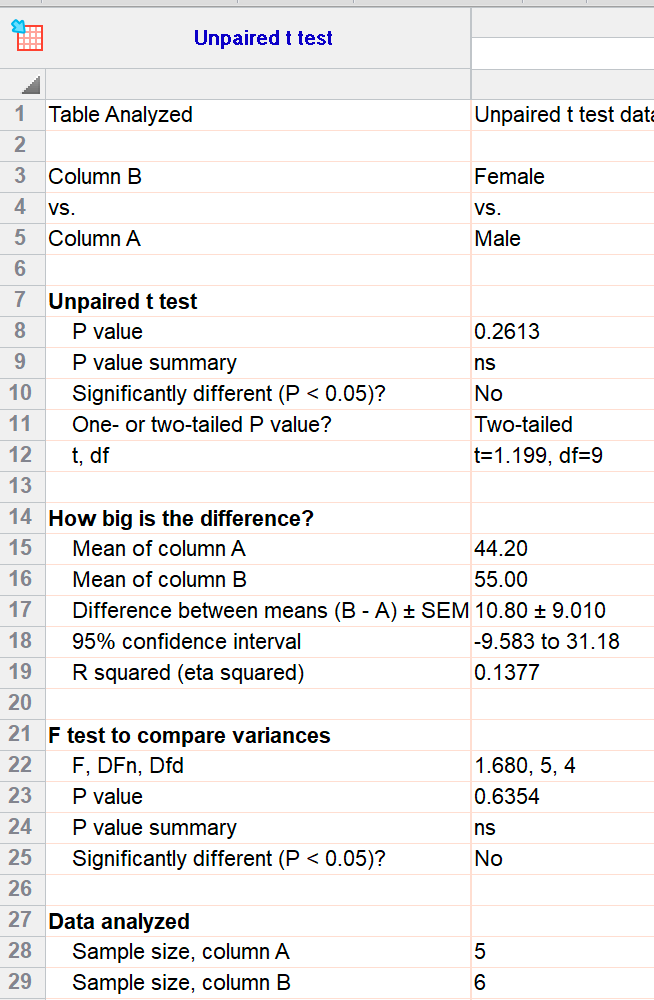
These sheets show the results of your analyses. You can copy from here and paste parts of your results onto graphs. Learn more.

|
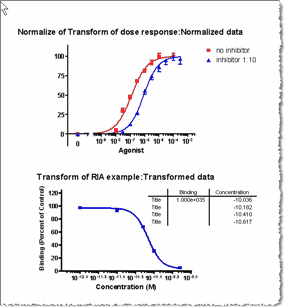
Once you enter your data in a data table, Prism automatically creates a graph. You can customize any part of a graph. Learn more.

|
Combine several graphs or other sheets in a layout for printing or publishing. You also can send layouts directly to PowerPoint and Word. Learn more.

|
|