Navigation: STATISTICS WITH PRISM 8 > Survival analysis > Graphing survival data
Cumulative incidence graphs
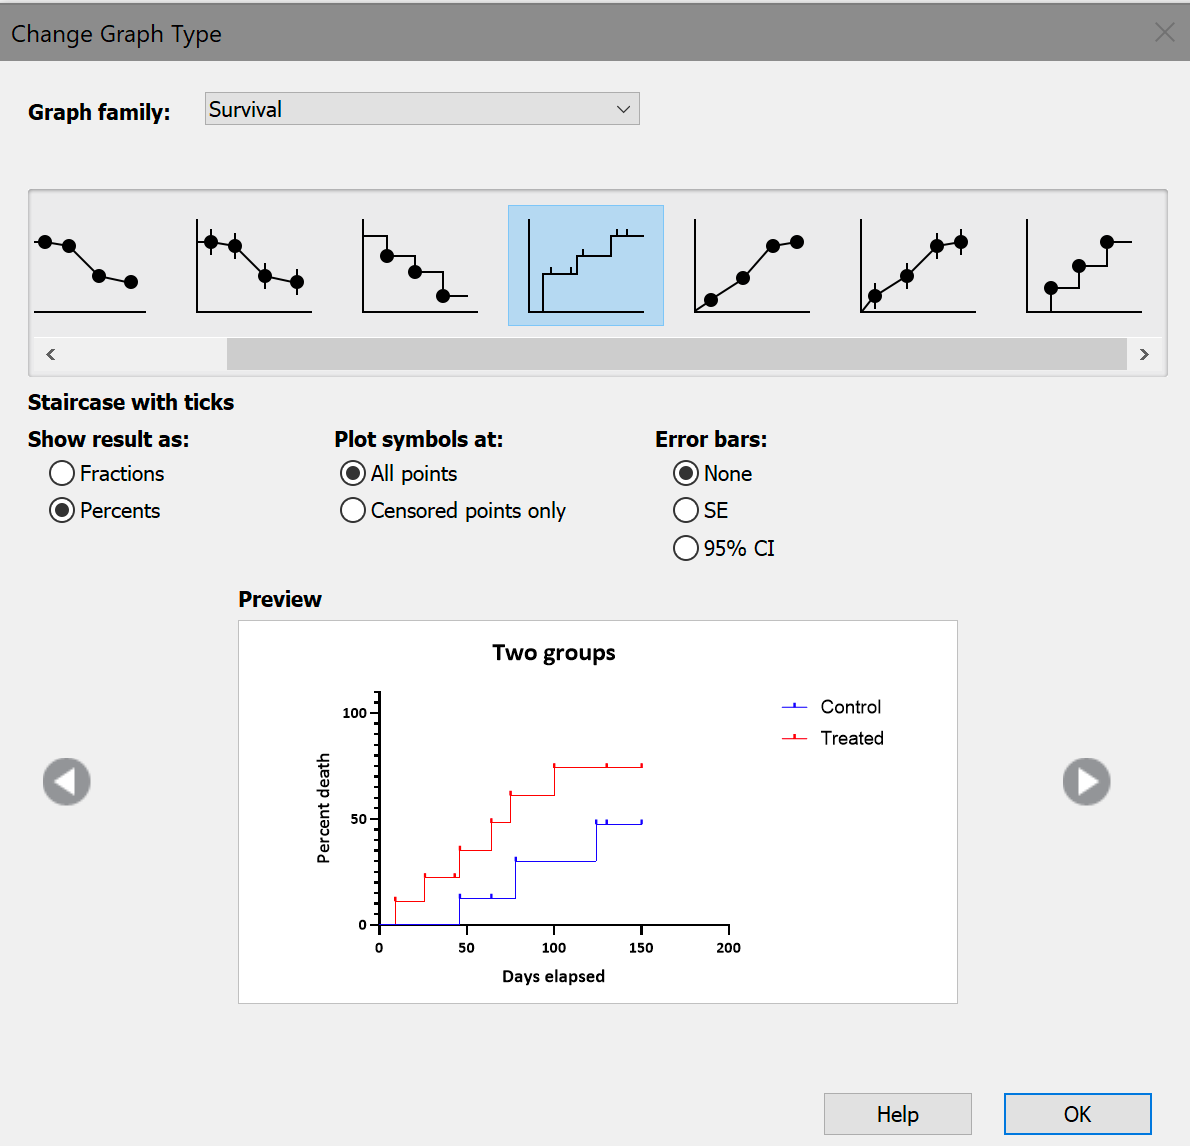
Survival graphs start at 100% (or1.0) and go down to zero.
Cumulative incidence graphs start at 0 and go up to a maximum of 100 (percent) or 1.0 (fraction). Choose a cumulative incidence graph at the top right of the Change graph type dialog.