How to: Area under the curve
The area under the curve is an integrated measurement of a measurable effect or phenomenon. It is used as a cumulative measurement of drug effect in pharmacokinetics and as a means to compare peaks in chromatography.
Note that Prism also computes the area under a Receiver Operator Characteristic (ROC) curve as part of the separate ROC analysis.
Start from a data or results table that represents a curve. Click Analyze and choose Area under the curve from the list of XY analyses.

Interpreting area-under-the-curve results
If your data come from chromatography or spectroscopy, Prism can break the data into separate regions and determine the highest point (peak) of each. Prism can only do this, however, if the regions are clearly defined: the signal, or graphic representation of the effect or phenomenon, must go below the baseline between regions and the peaks cannot overlap.
For each region, Prism shows the area in units of the X axis times units of the Y axis. Prism also shows each region as a fraction of the total area under all regions combined. The area is computed using the trapezoid rule. It simply connects a straight line between every set of adjacent points defining the curve, and sums up the areas beneath these areas.
Next, Prism identifies the peak of each region. This is reported as the X and Y coordinates of the highest point in the region and the two X coordinates that represent the beginning and end of the region.
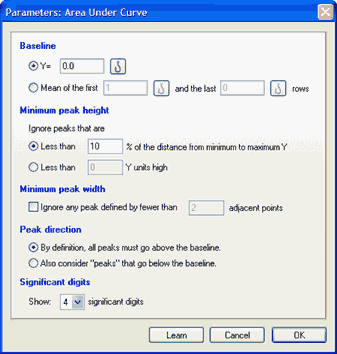
Prism may identify more regions than you are interested in. In this case, go back to the Parameters dialog box and enter a larger value for the minimum width of a region and/or the minimum height of a peak.
Limitations of this analysis
Note these limitations:
•The baseline must be horizontal.
•There is no smoothing or curve fitting.
•Prism will not separate overlapping peaks. The program will not distinguish two adjacent peaks unless the signal descends all the way to the baseline between those two peaks. Likewise, Prism will not identify a peak within a shoulder of another peak.
•If the signal starts (or ends) above the baseline, the first (or last) peak will be incomplete. Prism will report the area under the tails it “sees”.
•Prism does not extrapolate back to X=0, if your first X value is greater than zero.
•Prism does not extrapolate beyond the highest X value in your data set, so does not extrapolate the curve down to the baseline.
•Prism no longer insists that the X values be equally spaced. When it sums the areas of the trapezoids, it is fine if some are fatter than others.
How Prism computes area under the curve
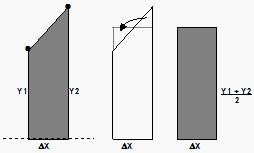
Prism computes the area under the curve using the trapezoid rule, illustrated in the figure below.

In Prism, a curve (created by nonlinear regression) is simply a series of connected XY points, with equally spaced X values. Prism can compute area under the curve also for XY tables you enter, and does not insist that the X values be equally spaced. The left part of the figure above shows two of these points and the baseline as a dotted line. The area under that portion of the curve, a trapezoid, is shaded. The middle portion of the figure shows how Prism computes the area. The two triangles in the middle panel have the same area, so the area of the trapezoid on the left is the same as the area of the rectangle on the right (whose area is easier to calculate). The area, therefore, is ΔX*([(Y1+Y2)/2]-Baseline]. Prism uses this formula repeatedly for each adjacent pair of points defining the curve.
The area is computed using the baseline you specify and the curve between two X values. Which X values?
•If all your data points are larger than the baseline, the AUC calculations start at the lowest X value in your data set and end at the largest X value. Note that Prism does not extend the curve beyond the X range of your data.
•If the Y values at the lowest X values are below your baseline: Prism finds the smallest X value in your data associated with a Y value greater than the baseline. It draws a line between that point and the point with the next smallest X value in your data set. It then uses linear interpolation to find where that line crosses the baseline, and uses that interpolated value as the first X value to compute the AUC.
•If the Y values at the largest X values are below your baseline: Prism finds the largest X value in your data associated with a Y value greater than the baseline. It draws a line between that point and the point with the next largest X value in your data set. It then uses linear interpolation to find where that line crosses the baseline, and uses that interpolated value as the last X value to compute the AUC.
The standard error and confidence interval of the AUC
If you enter data with replicate Y values, or as Mean and SD or SEM, Prism reports a SE and confidence interval for the AUC using the method described by Gagnon (1). If you entered replicate Y values in subcolumns, Prism assumes these are replicate measurements in one experiment. If each subcolumn is in fact a different repeated experiment, Prism does not compute one AUC per subcolumn, and then average those values. The 95% confidence interval equals the AUC plus or minus 1.96 times the SE. It uses the z distribution (so always 1.96) rather than the t distribution (where the value would depend on sample size) because this was used in references 1-3. With more than a few dozen points defining the curve, the t and z methods will be nearly indistinguishable.
Prism does not compare peaks to provide a confidence interval for the difference or the corresponding P value. But you can get Prism to do this with a bit of work:
1.Create a new Grouped table, formatted for entry of mean, sem and n. You will enter values only into the first row of this table.
2.Enter the AUC values as means.
3.Enter the SE of the AUC values as "SEM".
4.Define the df for each group as the number of data points for that group minus the number of concentrations.
5.For n, enter one more than the df. When Prism does the t tests, it will subtract 1 from the entered n to obtain the df, which will now be correct.
6.Click analyze and choose the t test if you want to compare two AUCs, or one-way ANOVA if you want to compare three or more.
More details and full example.
What counts as a peak?
By default, Prism only considers points above the baseline to be part of peaks, so only reports peaks that stick above the baseline. You can choose to consider peaks that go below the baseline.
By default, Prism ignores any peaks whose height is less than 10% of the distance from minimum to maximum Y value, but you can change this definition in the area under the curve parameters dialog. You can also tell it to ignore peaks that are very narrow.
Total peak area vs. total area vs. net area
Prism reports the area under the peaks in two or three ways:
•Total Area. This sums positive peaks, negative peaks, peaks that are not high enough to count, and peaks that are too narrow to count. The only choice you make in the analysis dialog that affects the definition of total area is the definition of the baseline.
•Total Peak Area. The sum of the peaks you asked Prism to consider. This value is affected by several choices in the analysis dialog: The definition of baseline, your choice about including or ignoring negative peaks, and your definition of peaks too small to count.
•Net Area. You'll only see this value if you ask Prism to define peaks below the baseline as peaks. It is the difference computed by subtracting the area of peaks below the baseline from the area of peaks above the baseline.
Reference
1.Robert C. Gagnon and John J. Peterson, Estimation of Confidence Intervals for Area Under the Curve from Destructively Obtained Pharmacokinetic Data, Journal of Pharmacokinetics and Pharmacodynamics, 26: 87-102, 1998.
2.Bailer A. J. (1988). Testing for the equality of area under the curves when using destructive measurement techniques. Journal of Pharmacokinetics and Biopharmaceutics, 16(3):303-309.
3.Jaki T. and Wolfsegger M. J. (2009). A theoretical framework for estimation of AUCs in complete and incomplete sampling designs. Statistics in Biopharmaceutical Research, 1(2):176-184.