When defining an equation, you can also ask Prism to report transforms of the best-fit values on the "Transforms to report" tab.
Transforms of one parameter
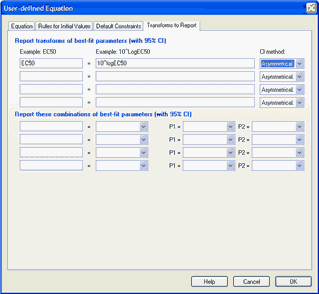
Entering the transform
Enter simple transforms of one parameter. On the left side enter the name you want to give the results. On the right side enter the transform.
Example: You fit data to an equation that includes a parameter logEC50 that is the logarithm of an EC50, but you want to also report the EC50. Enter the label 'EC50' on the left and '10^logEC50' on the right (without the quotes).
Example: You fit data to an equation that reports a rate constant K, but also want to report the half-life. Enter the label 'HalfLife' on the left and 'ln(2)/K' on the right (without the quotes).
Confidence intervals - Symmetrical vs. asymmetrical
This choice only has an impact when you have chosen "symmetrical, asymptotic, approximate confidence intervals" in the Confidence tab.
•Symmetrical confidence interval. Prism also reports the SE of that parameter, and both SE and CI are exactly the same as they would have been if you had fit that transformed parameter directly. For example if you fit an exponential decay model to determine the rate constant, and transform that rate constant (take its reciprocal) to compute the time constant, the SE and CI of the time constant will be exactly the same as they would have been had you fit the time constant directly.
•Asymmetrical confidence interval. Prism transforms both confidence limits to create the confidence interval of the transformed parameter. In most cases, this transformed confidence interval will not be symmetrical.
Choosing between the two is often not straightforward. The symmetrical intervals give you the results you would have had if you had chosen to express the model differently. The asymmetrical results simply express the same confidence interval on a different scale. You want to compute the confidence intervals on the scale where the true uncertainty is most symmetrical. You can then transform those confidence limits to come up with asymmetrical confidence interval on a different scale.
If you really care to know the confidence intervals of the parameters and transforms of the parameters with precision, choose "asymmetrical, profile-likelihood" confidence intervals in the Confidence tab of nonlinear regression. When you make this choice, the choice about symmetrical or asymmetrical confidence interval is ignored, and you'll get the same results with either choice. You make the choice when defining the equation. At that point, Prism doesn't know if you are going to choose profile likelihood intervals or not, so the choice is always available. However the choice is ignored for fits where you choose profile likelihood intervals.
Notes:
•Prism 4 (and earlier) always reported the asymmetrical intervals for EC50 and half lives, but did not offer the choice of transforming parameters in user-defined models.
•If your transform simply changes units, then Prism still offers the two choices, but the choice doesn't matter as both end up being exactly the same. This is the case whenever the transform of parameter K is of the form a*K+b
•Don't mix up the two choices for reporting the CI of transformed parameters discussed here with the two methods for reporting the CI of the parameters themselves.
•Prism only reports results when the results of the transform is monotonic. Otherwise the results will be blank. This is true for both symmetric and asymmetric confidence intervals.
Interpolating transforms
How to interpolate points off the curve
You can also use these 'transforms' to report values from the curve. The interpolated value and its confidence interval will appear in the results, the same as other transformed parameters.
Use this syntax:
Y[value or parameter] |
The Y value of the curve when X is the value you enter within the brackets. The Y value will be computed for any X, but confidence intervals will be calculated only when the X value is within the range of the X axis. |
X[value or parameter] |
The X value of the curve when Y is the value you enter within the brackets. Prism searches for the Y value you entered within the range the curve is plotted (Range tab) and extending in each direction a distance equal to half that range. It reports the smallest X value it finds within that range that corresponds to the Y value you entered, and doesn't alert you when the curve oscillates so there are several X values at a particular Y value. If both X and Y are within the axis range, a confidence interval is also calculated. |
Within the brackets, enter one of the following:
•A number
• The name of a parameter
•The name of a transformed parameter (defined earlier on this page). This is new to Prism 8.
Example: You fit data to a log(dose) response curve and want to report the antilog of the X value (dose) when Y=50 (which is not always the same as the EC50). For the second example, you would enter "Dose at Y=50' on the left, and '10^X[50]' on the right.
Confidence intervals
The confidence interval for interpolating transforms is computed by interpolating the confidence bands of the regression curve. You don't have a choice of symmetrical vs. asymmetrical intervals, and your choice for symmetrical Wald or asymmetrical profile-likelihood confidence intervals don't apply here (only to parameters and functions of parameters).
Don't mix up confidence intervals of transformed parameters with confidence interval of interpolated values
In spite of the fact that confidence intervals of transformed parameters and the confidence interval of interpolated values look the same in Prism's results tables, they are actually quite different. The transform of a parameter could have been a parameter had the equation been written differently. In contrast, an interpolating transform is the predicted value of the curve. The idea of a CI of interpolating transform is the same as the idea of the confidence band of the curve.
Note a potential point of confusion. The CI of interpolated values are shown in a results section with a title that depends on selected method: symmetrical Wald or asymmetrical profile likelihood. However the CI of interpolating transform are calculated using a method that has to do with confidence bands, and has nothing to do with the method used to compute the confidence of the parameters, even though it is in a section labeled that way.
Combining two parameters
Usefulness of combining parameters
The bottom half of the tab lets you define combinations of parameters to report. For example, you can report the sum of two parameters, or the ratio. Enter the name you want to give to the transform on the left, and then choose the calculation from the drop-down list (say "P1/P2" for a ratio). Then choose which parameter is P1 and which is P2 in the drop downs on the right.
Confidence intervals
When Prism combines two parameters to come up with a calculated value, it is smart about propagating the errors. The standard error and confidence interval it reports for the calculated variable are exactly the same as they would have been had you rearranged the equation to directly fit that calculated value.
When Prism reports the difference or ratio (etc) of two parameters, with standard error and confidence interval, the calculations account for the covariance of the two parameters. See this document.