Outlier elimination is misleading when you are fitting the wrong model

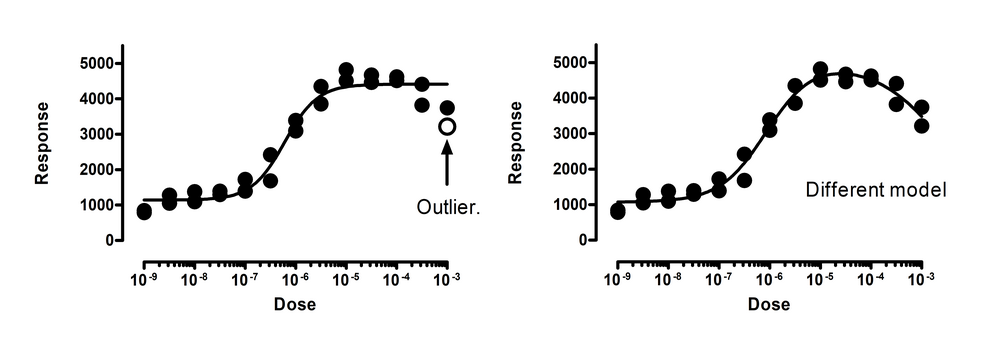
The left panel above shows the data fit to a dose response curve. In this figure, one of the points is a significant outlier. But this interpretation assumes that you’ve chosen the correct model. The right panel shows the data fit to an alternative bell-shaped dose-response model, where high doses evoke a smaller response than does a moderate dose. The data fit this model very well, with no outliers detected (or even suspected).
This example points out that outlier elimination is only appropriate when you are sure that you are fitting the correct model.
Outlier elimination is misleading when data points are not independent

The left panel above show data fit to a dose-response model with one point (in the upper right) detected as an outlier. The right panel shows that the data really come from two different experiments. Both the lower and upper plateaus of the second experiment (shown with upward pointing triangles) are higher than those in the first experiment (downward pointing triangles). Because these are two different experiments, the assumption of independence was violated in the analysis in the left panel. When we fit each experimental run separately, no outliers are detected.
Outlier elimination is misleading when you chose incorrect weighting factors

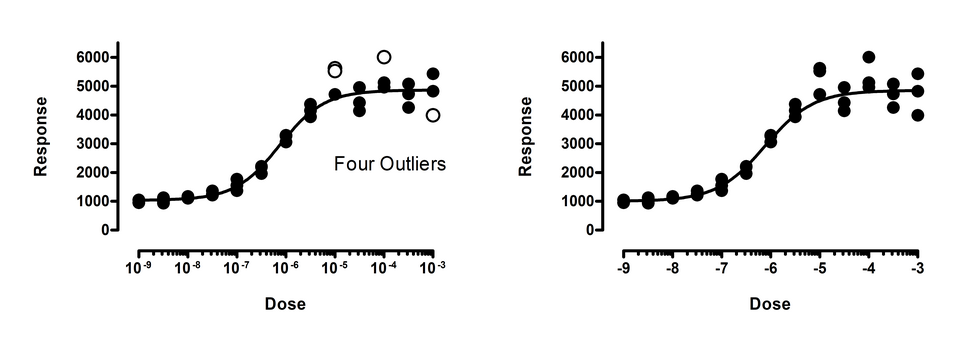
The left panel above shows data fit to a dose-response model. Four outliers were identified (two are almost superimposed). But note that the values with larger responses (Y values) also, on average, are further from the curve. This makes least-squares regression inappropriate. To account for the fact that the SD of the residuals is proportional to the height of the curve, we need to use weighted regression. The right panel shows the same data fit to the same dose-response model, but minimizing sum of the squares of the distance of the point from the curve divided by the height of the curve, using relative weighting. Now no outliers are identified. Using the wrong weighting method created false outliers.