Step by step
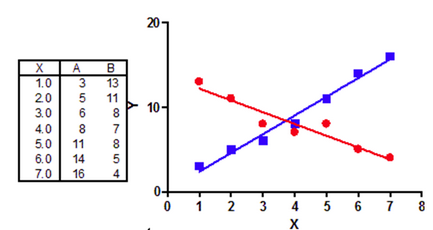
Create an XY data table. There is one X column, and two Y columns. If the X values don't match for the two data sets, just leave some Y values blank, staggering the entry down the page.
Click Analyze, choose nonlinear regression, choose the panel equations for lines, and choose Two intersection lines --fit the crossing point.
Model
Y= Ycross + (X - Xcross)*Slope
Interpret the parameters
•Slope for the first data set
•Slope for the second data set
•Xcross. The X coordinate of the crossing point (shared for both data sets)
•Ycross. The Y coordinate of the crossing point (shared for both data sets).
That makes sense. You have two lines, and it takes two parameters (usually a slope and intercept) to describe each. Here, the equations were rearranged so the program doesn't fit two separate Y intercepts, but rather fits the X and Y values of the crossing point as well as two slopes.
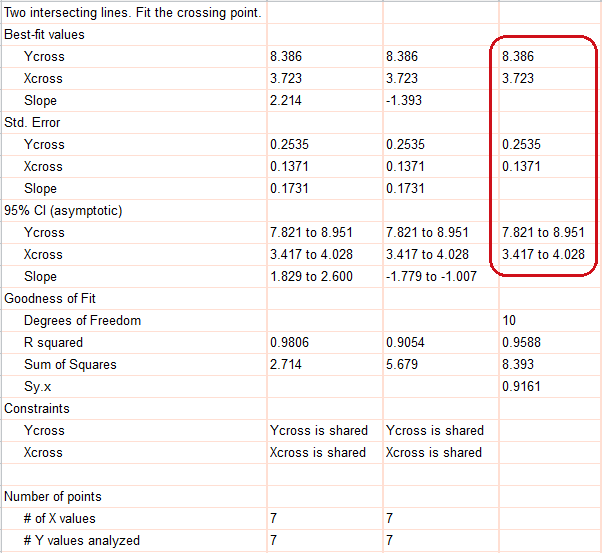
Here is an example, with the key results circled. Prism file.