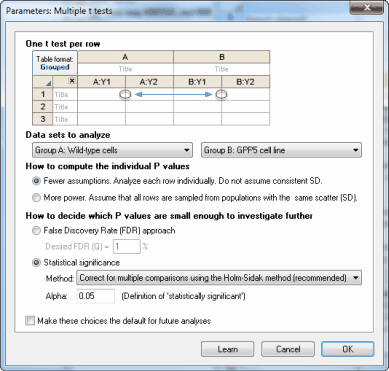
How to compute the individual P values
Prism computes an unpaired t test for each row, and reports the corresponding two-tailed P value. There are two ways it can do this calculation.
•Fewer assumptions. With this choice, each row is analyzed individually. The values in the other rows have nothing at all to do with how the values in a particular row are analyze. There are fewer df, so less power, but you are making fewer assumptions. Note that while you are not assuming that data on different rows are sampled from populations with identical standard deviations, you are assuming that data from the two columns on each row are sampled from populations with the same standard deviation. This is the standard assumption of an unpaired test -- that the two samples being compared are sampled from populations with identical standard deviations.
•More power. You assume that all the data from both columns and all the rows are sampled from populations with identical standard deviations. This is the assumption of homoscedasticity. Prism therefore computes one pooled SD, as it would by doing two-way ANOVA. This gives you more degrees of freedom and thus more power.
Choosing between these options is not always straightforward. Certainly if the data in the different rows represent different quantities, perhaps measured in different units, then there would be no reason to assume that the scatter is the same in all. So if the different rows represent different gene products, or different measures of educational achievement (to pick two very different examples), then choose the "few assumptions" choice. If the different rows represent different conditions, or perhaps different brain regions, and all the data are measurements of the same outcome, then it might make sense to assume equal standard deviation and choose the "more power" option.
How to decide which P values are small enough to investigate further
When performing a whole bunch of t tests at once, the goal is usually to come up with a subset of comparisons where the difference seems substantial enough to be worth investigating further. Prism offers two approaches to decide when a two-tailed P value is small enough to make that comparison worthy of further study.
One approach is based on the familiar idea of statistical significance.
The other choice is to base the decision on the False Discovery Rate (FDR; recommended). The whole idea of controlling the FDR is quite different than that of declaring certain comparisons to be "statistically significant". This method doesn't use the term "significant" but rather the term "discovery". You set Q, which is the desired maximum percent of "discoveries" that are false discoveries. In other words, it is the maximum desired FDR.
Of all the rows of data flagged as "discoveries", the goal is that no more than Q% of them will be false discoveries (due to random scatter of data) while at least 100%-Q% of the discoveries are true differences between population means. Read more about FDR. Prism offers three methods to control the FDR.
How to deal with multiple comparisons
If you chose the False Discovery Rate approach, you need to choose a value for Q, which is the acceptable percentage of discoveries that will prove to be false. Enter a percentage, not a fraction. If you are willing to accept 5% of discoveries to be false positives, enter 5 not 0.05. You also need tochoose which method to use.
If you choose to use the approach of statistical significance, you need to make an additional decision about multiple comparisons. You have three choices:
•Correct for multiple comparisons using the Holm-Šídák method (recommended). You specify the significance level, alpha, you want to apply to the entire family of comparisons. The definition of "significance" is designed so that if all the null hypotheses were true for every single row, the chance of declaring one or more row's comparison to be significant is alpha.
•Correct for multiple comparisons using the Šídák-Bonferroni method (not recommended). The Bonferroni method is much simpler to understand and is better known than the Holm-Šídák method, but it has no other advantages. The Holm-Šídák method has more power, and we recommend it. Note that if you choose the Bonferroni approach, Prism always uses the Šídák-Bonferroni method, often just called the Šídák method, which has a bit more power than the plain Bonferroni (sometimes called Bonferroni-Dunn) approach -- especially when you are doing many comparisons.
•Do not correct for multiple comparisons (not recommended). Each P value is interpreted individually without regard to the others. You set a value for the significance level, alpha, often set to 0.05. If a P value is less than alpha, that comparison is deemed to be "statistically significant". If you use this approach, understand that you'll get a lot of false positives (you'll get a lot of "significant" findings that turn out not to be true). That's ok in some situations, like drug screening, where the results of the multiple t tests are used merely to design the next level of experimentation.
