How Prism reports the slope and intercet
Prism first reports the best-fit values of the slope and intercept, along with their standard errors. It also reports the X intercept and the reciprocal of the slope. Below those values, it reports the 95% confidence interval of the slope and both intercepts.
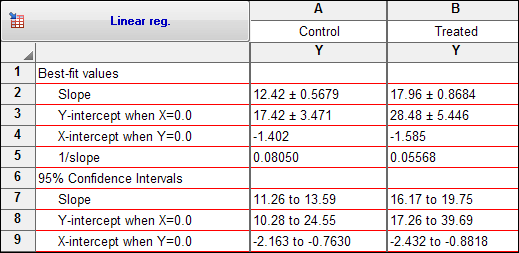
At the bottom of the results page, the slope and intercept are reported again in the form of the equation that defines the best-fit line. You can copy this equation and paste onto a graph, or into a manuscript.

Interpreting the slope and intercept
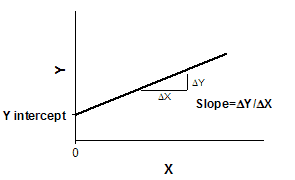
The slope quantifies the steepness of the line. It equals the change in Y for each unit change in X. It is expressed in the units of the Y-axis divided by the units of the X-axis. If the slope is positive, Y increases as X increases. If the slope is negative, Y decreases as X increases.
The Y intercept is the Y value of the line when X equals zero. It defines the elevation of the line.
Interpreting the standard errors and confidence intervals
The standard error values of the slope and intercept can be hard to interpret, but their main purpose is to compute the 95% confidence intervals.
If you accept the assumptions of linear regression, there is a 95% chance that the 95% confidence interval of the slope contains the true value of the slope, and that the 95% confidence interval for the intercept contains the true value of the intercept. The width of the confidence intervals is determined by the number of data points, their distances from the line, and the spacing of the X values.
Prism can also plot either the confidence or prediction bands.