|
Navigation: REGRESSION WITH PRISM 7 > Linear regression with Prism > Results of linear regression Questions and answers |
Scroll Prev Top Next More |

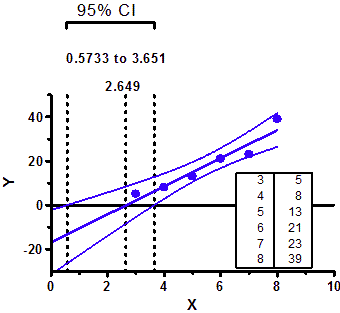
The 95% confidence interval for the X-intercept is not symmetrical around the X-intercept. It goes further in one direction than the other, as illustrated in the graph below.
Follow the Y=0 baseline from left to right. The region between the 95% confidence bands for the best fit line (blue curves) is the 95% CI of the X intercept. You can see that this confidence interval (between the two outmost dotted lines) is not symmetrical around the X intercept (the middle dotted line). This asymmetry will be very noticeable if you only have a few points with lots of scatter, and will be almost unnoticeable with lots of points with little scatter. GraphPad Prism reports the 95% confidence interval of the X intercept if you check an option on the Linear regression parameters dialog. Because the uncertainty is not symmetrical, it rarely makes sense to report a standard error of the X-intercept. It is much better to report both ends of the 95% confidence interval, which Prism reports. If you really want to compute a single standard error for the X intercept, you can do so by choosing nonlinear regression, and fitting this user-defined equation to the data: Y = slope*(X-Xintercept) Prism will report the best-fit value of the X intercept along with a SE and 95% confidence interval. Since this confidence interval will be computed from the SE value it will be symmetrical around the X intercept, and so won't be as accurate as the asymmetrical interval reported by linear regression. |
Prism tests whether the best-fit slope from linear regression line differs significantly from zero. But you need to use extra steps to test whether the slope differs from some other value. Since Prism's linear regression analysis can't answer the question, use nonlinear regression instead. Nonlinear regression can fit a straight line and offers many advantages. In the nonlinear regression parameters dialog, go to the Compare tab, check the option to ask compare the best-fit value of a parameter to a theoretical value, and then choose Slope and enter the theoretical value (1.0). |
Prism's linear regression analysis cannot handle differential weighting. However, Prism's nonlinear regression analysis can do weighted regression, and you can fit a straight line using "nonlinear" regression. |
Prism's linear regression analysis cannot constrain the slope to a particular value. However, Prism's nonlinear regression analysis can constrain any parameter to any value, and you can fit a straight line using "nonlinear" regression. |
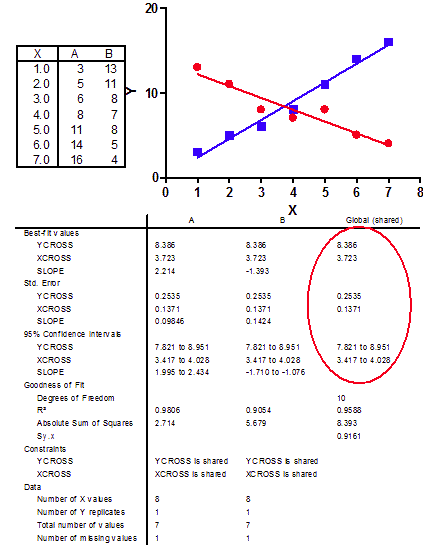
Prism usually fits one line through each data set. But you can get it to fit one line through all the data. Use the nonlinear regression analysis to fit the line. Then go to the Constrain tab, and share both the slope and the intercept. "Sharing" means that Prism fits one best-fit value for all the data sets, rather than one for each data set. Since you share all the parameters, only one line is fit to all the data. |
The problem is that when you constrain a line to go through a point, there would be two ways to compute R2: •Compare the fit of the best-fit line with the fit of a horizontal line at the mean Y value. But that null hypothesis (horizontal line through the Ymean) doesn't obey the constraint that it go through the origin. •Compare the best-fit line with a horizontal line at Y=0. This obeys the constraint, but often fits the data really badly, pushing up the R2 value. Since R2 is ambiguous when you constrain linear regression, Prism simply does not report it when you force the line through the origin (or other point). If you fit the line with nonlinear regression, Prism will report R2 using the first definition above. |
Enter your data onto one data table, with Y values in columns A and B next to corresponding X values in the X column. If the X values don't match for the two data sets, just leave some Y values blank. Use nonlinear regression, and enter this user-defined equation. Y= Ycross + (X - Xcross)*Slope This equation defines the Y coordinate of any point along either line to equal the Y coordinate of the crossing point plus the slope times the X distance from the crossing point to that point. Set these rules for initial values: •Ycross: 1*Ymid (the average of the highest and lowest Y values) •Xcross: 1*Xmid •Slope: 1*(Ymax-Ymin)/(Xmax-Xmin). Define Xcross and Ycross to both be shared parameters, so Prism will find one global best-fit value for those parameters that applies to both data sets. Do not share the slope parameter, as you want Prism to fit separate slopes for each data set. Getting these sharing settings correct is essential. Prism will fit four parameters: •Slope for the first data set •Slope for the second data set •Xcross (shared for both data sets) •Ycross (shared for both data sets). That makes sense. You have two lines, and it takes two parameters (usually a slope and intercept) to describe each. Here, the equations were rearranged so the program doesn't fit two separate Y intercepts, but rather fits the X and Y values of the crossing point. Here is an example, with the key results circled. Prism file.
|
© 1995-2019 GraphPad Software, LLC. All rights reserved.