The extra sum-of-squares F test compares the fits of two nested models. Nested means one model (the simpler one, model 1 below) is a special case of the other model (the more complicated one; model 2 below).
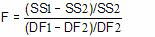
If the simpler model is correct, the relative increase in the sum of squares (going from more complicated to simpler model) is expected to equal the relative increase in degrees of freedom. In other words, if the simpler model is correct you expect that:

SS1 is the sum-of-squares for the simpler model (which will be higher) and SS2 is the sum-of-squares of the more complicated model. Recall that the number of degrees of freedom equals the number of data points minus the number of parameters. The more complicated model has more parameters so has fewer degrees of freedom.
If the more complicated model is correct, then you expect the relative increase in sum-of-squares (going from complicated to simple model) to be greater than the relative increase in degrees of freedom:

The F ratio quantifies the relationship between the relative increase in sum-of-squares and the relative increase in degrees of freedom.
That equation is more commonly shown in an equivalent form:

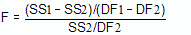
F ratios are always associated with a certain number of degrees of freedom for the numerator and a certain number of degrees of freedom for the denominator. This F ratio has DF1-DF2 degrees of freedom for the numerator, and DF2 degrees of freedom for the denominator.
If the simpler model is correct you expect to get an F ratio near 1.0. If the ratio is much greater than 1.0, there are two possibilities:
•The more complicated model is correct.
•The simpler model is correct, but random scatter led the more complicated model to fit better. The P value tells you how rare this coincidence would be.
The P value answers this question:
If model 1 is really correct, what is the chance that you would randomly obtain data that fits model 2 so much better?
If the P value is low, conclude that model 2 is statistically significantly better than model 1. Otherwise, conclude that there is no compelling evidence supporting model 2, so accept the simpler model (model 1).