1. Create data table and enter data
From the Welcome (or New Table and graph) dialog, choose the Column tab.
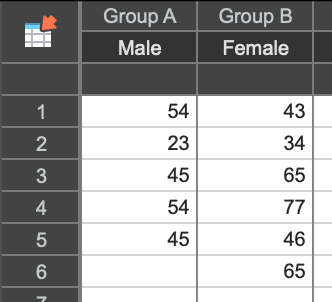
Choose to enter replicate values stacked in columns. Or, if you are not ready to enter your own data, choose sample data and choose: t test - unpaired.
Enter the data for each group into a separate column. The two groups do not have to have the same number of values, and it's OK to leave some cells empty.
2. Choose the unpaired t test
1.From the data table, click the Analyze button in the Analysis section of the toolbar.
2.Choose t tests (and nonparametric tests) from the list of column analyses.
3.On the first (Experimental Design) tab of t test dialog, make these choices:
•Experimental design: Unpaired
•Distribution assumption: choose the distribution (normal or lognormal) from which your data were sampled. Helpful tip: if the difference between groups is of interest, you may likely want to choose normal, while if the ratio between the groups is of interest you may likely want to choose lognormal.
•Choose test:
oWelch's t test or lognormal Welch's t test: This is the default option, and should be used if the variance cannot be assumed to be equal in both groups. For data sampled from normal distributions, this means that the standard deviations cannot be assumed to be equal. For lognormal distributions, it means that the geometric standard deviations of the populations cannot be assumed to be equal
oUnpaired t test or lognormal t test: If the variance can be assumed to be equal in both groups, this option can be selected. However, using Welch's variant is generally considered a reasonable default choice unless you are certain that the variances of the two populations are equal
4.On the options tab, make these choices:
•Choose a one- or two-sided P value. If in doubt, choose a two-tail P value.
•Choose the direction of the differences. This choice only affects the sign of the difference (or the ratio for lognormal tests) and its confidence interval, without affecting the P value.
•Choose a confidence level. Leave this set to 95%, unless you have a good reason to change it.
3. Review the results
The t test investigates the likelihood that the difference between the means of the two groups could have been caused by chance. So the most important results are the 95% confidence interval for that difference and the P value.
Learn more about interpreting results for t tests and the corresponding lognormal tests as well as graphing tips for these results.
Before accepting the results, review the analysis checklist:
•Checklist for lognormal t test