How Prism reports the slope and intercept
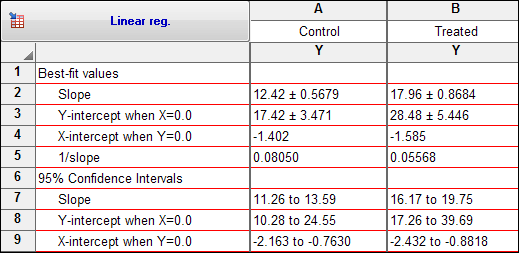
Prism first reports the best-fit values of the slope and intercept, along with their standard errors. It also reports the X intercept and the reciprocal of the slope. Below those values, it reports the 95% confidence interval of the slope and both intercepts.

At the bottom of the results page, the slope and intercept are reported again in the form of the equation that defines the best-fit line. You can copy this equation and paste onto a graph, or into a manuscript.

Interpreting the slope and intercept
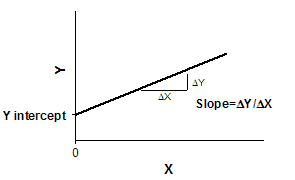
The slope quantifies the steepness of the line. It equals the change in Y for each unit change in X. It is expressed in the units of the Y-axis divided by the units of the X-axis. If the slope is positive, Y increases as X increases. If the slope is negative, Y decreases as X increases.
The Y intercept is the Y value of the line when X equals zero. It defines the elevation of the line.

Interpreting the standard errors and confidence intervals
The standard error values of the slope and intercept can be hard to interpret, but their main purpose is to compute the 95% confidence intervals.
If you accept the assumptions of linear regression, there is a 95% chance that the 95% confidence interval of the slope contains the true value of the slope, and that the 95% confidence interval for the intercept contains the true value of the intercept. The width of the confidence intervals is determined by the number of data points, their distances from the line, and the spacing of the X values.
Prism can also plot either the confidence or prediction bands.
The X intercept and its confidence interval
GraphPad Prism reports the 95% confidence interval of the X intercept if you check an option on the Linear regression parameters dialog.
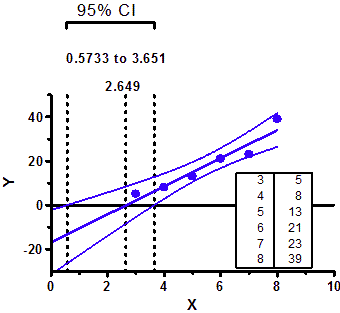
The 95% confidence interval for the X-intercept is not symmetrical around the X-intercept. It goes further in one direction than the other, as illustrated in the graph below.

Follow the Y=0 baseline from left to right. The region between the 95% confidence bands for the best fit line (blue curves) is the 95% CI of the X intercept. You can see that this confidence interval (between the two outermost dotted lines) is not symmetrical around the X intercept (the middle dotted line).
This asymmetry will be very noticeable if you only have a few points with lots of scatter, and will be almost unnoticeable with lots of points with little scatter.
Because the uncertainty is not symmetrical, it rarely makes sense to report a standard error of the X-intercept. It is much better to report both ends of the 95% confidence interval, which Prism reports. If you really want to compute a single standard error for the X intercept, you can do so by choosing nonlinear regression, and fitting this user-defined equation to the data:
Y = slope*(X-Xintercept)
Prism will report the best-fit value of the X intercept along with a SE and 95% confidence interval. Since this confidence interval will be computed from the SE value it will be symmetrical around the X intercept, and so won't be as accurate as the asymmetrical interval reported by linear regression.