
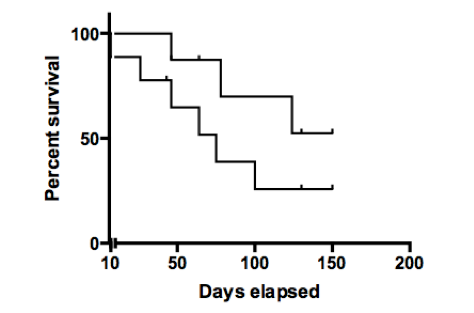
With Prism 6 Mac (up to 6.0f) Survival graph, the horizontal line starting at the Y Axis disappears when the X Axis range is changed from zero.
When creating a survival graph type, Prism automatically computes percent survival at each time starting at 100% survival at the Y Axis.
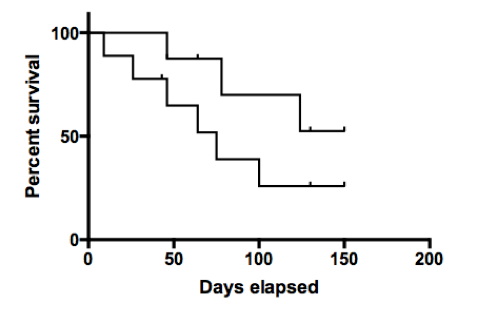
Manually adjusting the X Axis range, from the X Axis tab of the Format Axes dialog, causes the X Axis line at zero to disappear. Note: this is also true for XY graphs with connecting lines. This is a bug in Prism 6 Mac up to 6.0f, which we’ll fix this in the next update.
.png)
.png)
Bug details:
If you double click on the X Axis to go Format Axes dialog and then unselect the “Automatically determine the range and interval” box and change the Minimum Range of the X axis from zero, the horizontal line at 100% does not extend to the Y axis as it should.
There are two workarounds.
Workaround 1:
Start the range of the X Axis at zero and then make a discontinuous axis. This is a choice in the top left of the X Axis tab of the Format Axes dialog. You'll need to try a few range settings to make both sides of the discontinuous X Axis look right.
Workaround 2:
Select the entire survival proportions results table that shows the percent survival as a function of time and copy it to the clipboard. Then, drop the file menu create choose to create a "New Data Table and Graph...". Create a new XY data table and paste the results into the new XY data table. Next, in row 1 of the data table, insert a new row and add the minimum X value you plan to use on the graph, with that X and Y=100. Finally, from the Format Axes dialog, adjust the axis and graph settings to get the graph to look the way you want.
Keywords: top line dissapears at zero