
KNOWLEDGEBASE - ARTICLE #1352
Graph tip - How can I make a graph of column data that combines bars and individual data points?
Column data
Prism 6 and later offers this an automatic option when selecting how to display your data for a Column graph type:

If you've already selected a graph type, with your graph in view, click the (Change Graph Type) .png) button under the change toolbar to choose a different graph type.
button under the change toolbar to choose a different graph type.
Prism 5 and earlier versions doesn't let you make a graph with bars or columns and also show the individual data points as a scatter plot. The workaround is to create a column scatter plot of your data with a line at the mean and then use the line drawing tool to draw vertical lines to complete the box.
Grouped graphs
Prism doesn't make graphs with bars and individual points automatically, but it is easy to get it to do what you want.
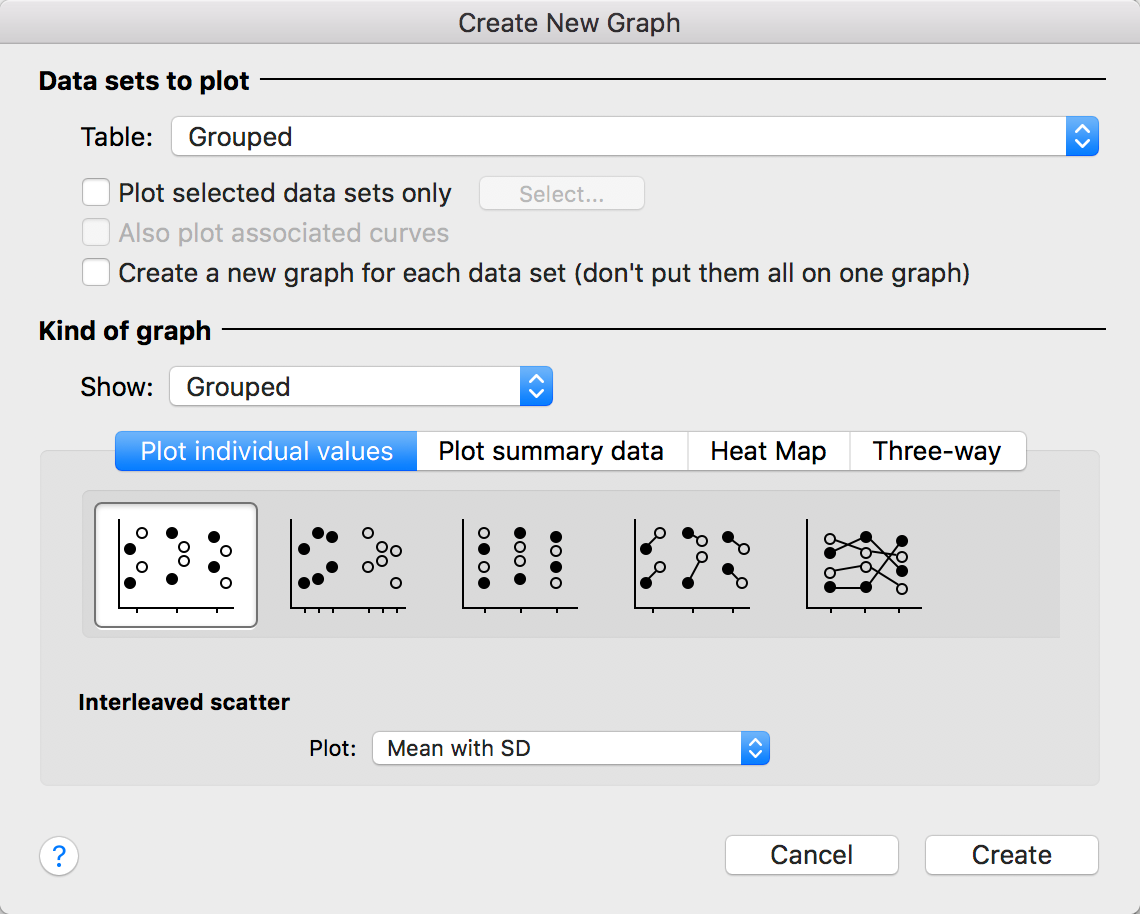
- Create a graph showing individual points. Make sure you are set to create a grouped graph, choose the tab for plotting individual points, and then pick any of the first three choices.
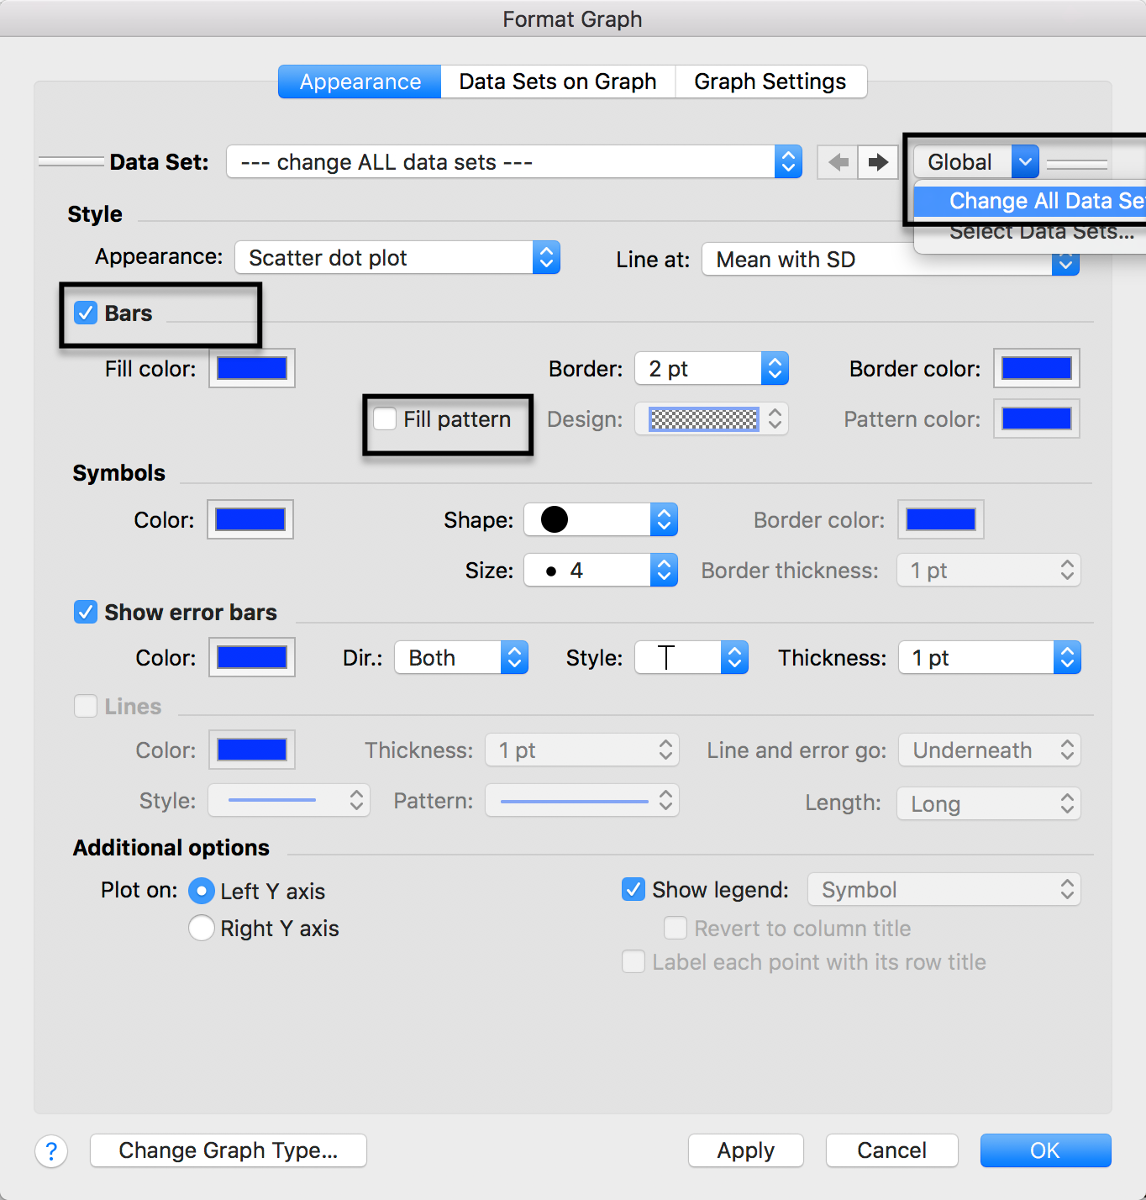
- Double click on the graph to bring up Format Graph.
- Use the Global drop down to change all data sets.
- Check the option to include a bar.
- Turn off fill patterns.
- Set the fill color to clear.


Keywords: column bar graph, column scatterplot,