
Analyze a 2x2 contingency table
Contingency tables are used to analyze counts of subjects to determine if there is association between two factors. This calculator is for 2x2 contingency tables that separate each subject into one of four categories based on two factors, each with two possibilities. Simply label the rows and columns, then type in the counts for each cell to test the relationship between the two factors. Learn more about contingency tables (along with when to use each test) in the description below the calculator.
What is a contingency table?
Contingency tables are used to analyze count data across two or more experimental factors by separating the subjects into the appropriate categories. An example is comparing subjects with and without some risk factor (such as smoking/non-smoking) and further categorizing by whether they have a disease (such as lung cancer).
Unlike regression analysis or ANOVA, both of the factors are categorical (rather than numeric variables). A 2x2 table means that subjects are separated based on two factors (or questions) with two levels in each factor (groups 1 or 2 for the first factor and outcome 1 or 2 for the second factor). Each subject falls into one of the two levels for each factor, which results in four possible categories in all.
The goal is to determine if the factors are associated, for example, a subject in group 1 may be more likely to be part of the outcome 2 category. Be careful with interpretation, though, as a relationship does not necessarily imply causation!
How to use the contingency table calculator
Enter your data into the contingency table calculator. Label your groups and outcomes, then enter the actual number of subjects in each category (whole numbers only, not percentages or decimals).
Which test should I use?
The typical statistical test for contingency tables evaluates if there is an association between the variables. We provide three ways to compute a P value from a contingency table:
- Chi-square is the standard method and is best when you have a large number of subjects in categories. It provides an approximate P value and can be calculated by hand as well. This is also known as the chi-square test of independence.
- Fisher's exact test is used to calculate P values for small sample sizes. It was created for a specific (and rare) experimental design where marginal totals are fixed. It's called an exact test, but that can be misleading because it's only exact if your experiment meets that condition.
- Yates' continuity correction can be used alongside chi-square. It makes the approximation more conservative but is not commonly used. Yates is sometimes appropriate to keep from overestimating the relationship. For large samples its effect is negligible.
Then select either a one-tailed or two-tailed test. Two-tailed is more common for contingency tables. You can read more about P values here.
If you want to enter observed and expected values for each category (or your analysis is not exactly four categories in a 2x2 contingency table) you need this chi-square calculator instead.
Performing contingency tests? We can help.
Sign up for more information on how to perform contingency tests and other common statistical analyses.
Assumptions of 2x2 contingency tables
Contingency tables and the tests listed above require the assumptions below to be met:
- Independence among the sample
- Unpaired subjects
- Analyzing counts (not percentages)
- Correct tabular set up
For more details, see our analysis checklist.
Example experiment setup
Suppose you recruit a fixed number of people with and without lung cancer. Then you interview each subject and record whether they are smokers or not. Notice these are both factors with exactly two possibilities.
This study would correspond to a contingency table like the one below, where you could count the number of subjects in each of the four categories. Testing the differences between the observed and expected counts can help you quantify the relationship between smoking and lung cancer.
Lung Cancer
Healthy
Smoking
Non-smoking
Chi-square test calculation details
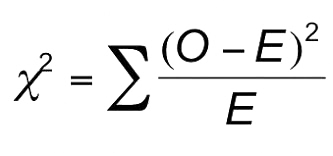
Chi-square tests compare the observed (O) and expected (E) frequencies of the subjects. With contingency table tests, the expected frequencies are calculated in the background based on the multiplication rule of probability. The idea is to use the row and column (marginal) totals to calculate the expected counts if there is no association between the variables. If the observed values vary significantly from the expected values (using a chi-square test), then there is statistical evidence of association.
The formula is:
Fisher's test calculation details
Several methods exist to calculate Fisher's test, and this calculator uses the summing small P values method. Fisher's test is rarely calculated by hand and can be very intensive even for a computer.
Interpreting Results
Statistical tests for contingency tables evaluate whether the factors are associated. After you click calculate, the P value will be reported along with a sentence describing its statistical significance. For chi-square this will also include the chi-square test statistic and its degrees of freedom.
This calculator assumes a P value significance threshold of 0.05.
The biggest mistake researchers make when interpreting contingency tables is assuming that a statistically significant result implies causation. This is not necessarily true for multiple reasons:
- Contingency tables do not tell us which influences the other. The results are the same even if you flip the placement of groups and outcomes in the table. As a silly example, you would certainly not want to conclude from our analysis that a lung cancer diagnosis causes people to smoke!
- There are often more than two factors at play. Don't underestimate the impact of randomness, or that your study may not have included the true causal factor.
Learn more about interpreting P values for contingency tables in our statistics guide. Note that while confidence intervals are not included in this calculator, they are easy to calculate in Prism.
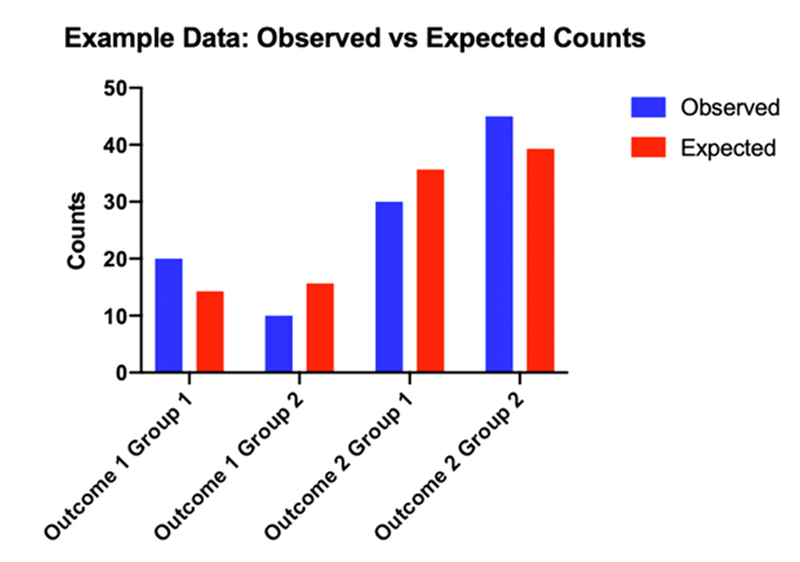
Graphing contingency table data
Although this calculator does not create a graphic of the relationship between the groups and outcomes, you might want to look at a grouped bar chart that compares your observed and expected counts. That will visually show you which categories vary from what would be expected if there was no association between the variables.
For example:
Ready for more advanced analyses?
While this calculator is good for basic analysis, Prism offers additional capabilities and publication-quality graphics.
Start your 30 day free trial of Prism and get access to additional features like:
- Analysis for tables larger than 2x2
- Effect size output including relative risk, odds ratios, and sensitivity
- Confidence interval calculations
- Compare proportions as well as frequencies
With Prism, in a matter of minutes you learn how to go from entering data to performing statistical analyses and generating high-quality graphs.
Analyze, graph and present your scientific work easily with GraphPad Prism. No coding required.