Prism 6 is a big upgrade with many improvements. It has more statistical clout, can make more kinds of graphs, and is even more efficient to use. But Prism is still Prism. The basic interface and organization of the program has not changed, so you can switch to Prism 6 with almost no learning curve. And you can try the Prism 6 demo without removing Prism 5. Statistics •Two-way ANOVA with repeated measures in both factors •Detect outliers in a column of data using Grubbs' test •Calculate and graph 95% CI of median with Wilcoxon test •Calculate and graph 95% CI of difference between medians with Mann-Whitney test •Greenhouse-Geisser correction in one-way repeated measures ANOVA •Ratio t test •Kolmogorov-Smirnov test (alternative to Mann-Whitney) •Multiple tests (one-per row) with optional correction for multiple comparisons •Monte-Carlo analyses Multiple comparisons •Exact (multiplicity adjusted) P values with Bonferroni, Tukey and Dunnett's tests. •Graph 95% CI of difference between means •New approach: Fisher’s unprotected Least Significant Difference (LSD) •New multiple comparisons test: Holm-Sidak •Test main or simple effects after two-way ANOVA •Dunnett's test now can handle up to 256 groups (up from 20)
Nonlinear regression •Fit to models defined by implicit and differential equations. •Write more complex models •Weight your fit by 1/YK •Much easier interpolation
Bigger data tables •Enter data in up to 256 data set columns (up from 52 in Prism 5) •Create data sets with up to 256 subcolumns (up from 52) to allow repeated measures 2 way ANOVA with more subjects
Row and column titles •Write two or three line titles •Use bold and italics •Make titles as long as necessary •View and edit all of your column titles at once
Work more efficiently •Faster in many ways: saving, graphing, exporting and closing •Nonparametric calculations are way way faster! •Format several data sets at once. Want to plot alternating columns as dotted lines? Now you can do it in one step. •Paste link data or results copied from Prism, and those values will be hot linked •Choose the size, shape and color of selected data points right from the data table •More choices when exporting •Set defaults as you work. Many dialogs now a have checkbox to make your choices on that dialog (or tab) become the defaults when you use that dialog in the future. •Much easier to create the graph you want since you don't pick the graph type until after entering data. Preview how different graphs look with your data before deciding. •Search a large project to find pages that include specified text
|
Zig-zag and elbow lines
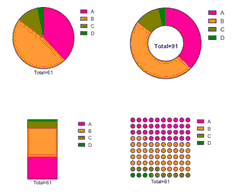
Pie charts and more
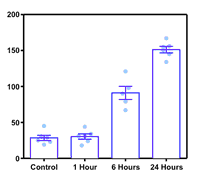
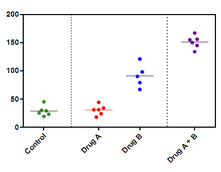
Superimpose individual data points with bars
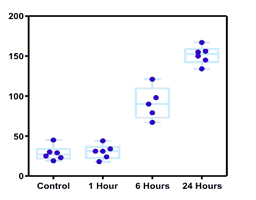
Superimpose individual data points with box-whiskers
Separate columns with lines
Label both sides of an axis |