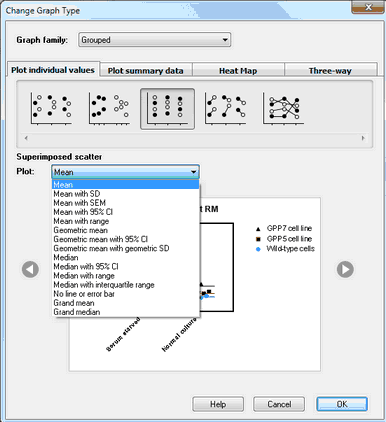
To plot the grand mean or grand median, plot grouped data (with individual replicates) on a Grouped graph, choose "Plot individual values" and then choose to plot a superimposed scatter plot. The last two choices on the Plot drop down menu will be to plot the Grand mean or Grand median. It is not possible to plot the grand mean or median with error bars, and it isn't totally clear even how those error bars would be defined.