New to Prism 7 is the ability to enter elapsed times instead of X values. This page explains how to make graphs when you entered data this way. Another page explains how prior versions of Prism dealt with dates and times.
The Format Axis dialog offers two new choices when you entered elapsed times instead of X values. '
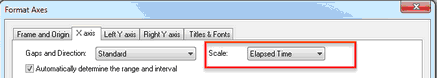
Elapsed time scale
At the top of the dialog, choose to use a Elapsed Time scale.
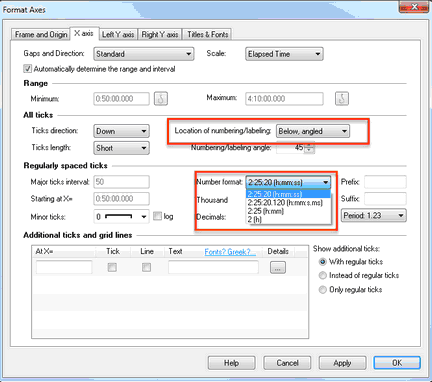
If you choose an Elapsed time scale, you can choose to display just hours, hours:minutes, hours:minutes:seconds or hours:minutes:seconds.milliseconds. To avoid overlap, you'll probably want the dates to be displayed vertically or at an angle (not horizontal).
Linear scale for X values entered as elapsed time
If you choose a linear (numerical) scale, Prism tells you what the units will be. These units are set on the data table.

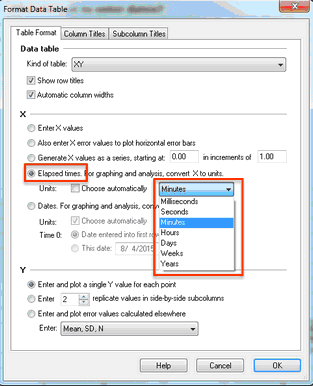
To change those units, go back to the data table, drop the Change menu, choose Format Data Table, then uncheck "Choose automatically" and select the units you want to use.
What values are used when you fit a curve or line to the data?
When you analyze an XY table with X values entered as elapsed times, Prism converts the elapsed times to numbers. To change the units (seconds, minutes,...), go back to the data table, drop the change menu, and choose Format Data Table.
Note that the choice of months is not offered, because months have different lengths. Years also have different lengths, so if you choose years, Prism does the conversion based on 365.25 days per year.