A depth chart is an XY plot rotated so the independent X variable is shown on the vertical axis, and the dependent Y variable is shown on the horizontal axis. This makes sense when the X variable is depth. Follow these steps:
1.Enter data on an XY table. Enter the depth values into the X column.
2.Prism will create an XY graph with X on the horizontal axis.
3.Use the Format Axis dialog to change the direction of the numbering on both axes. Set the X axis numbering to: Below, vertical. Set the Y axis numbering to: Left vertical.
4.Delete the automatic X axis title (because it cannot be rotated).
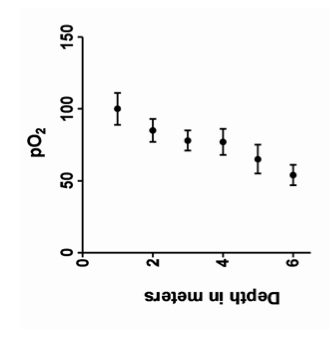
5.Create an independent text object with the depth title. Select it, and rotate 180 degrees by clicking the rotate button in the lower right of the Text area in the toolbar several times.Your graph will now look like this:
6.Assign that graph to a layout.
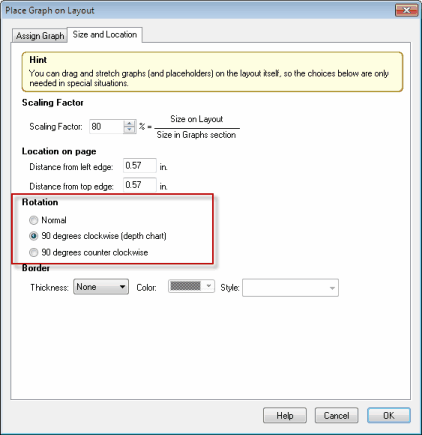
7.Double click on the graph to bring up the "Place graph on layout" dialog. Go to the second (Size and Location) tab, and choose to rotate 90 degrees clockwise.
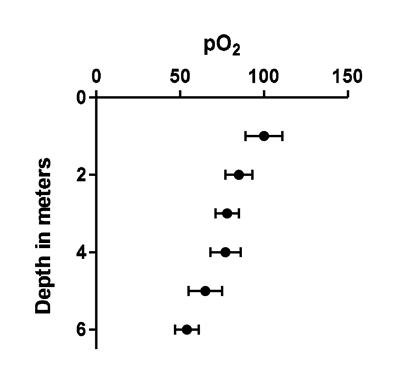
The result, on the layout, is a depth chart, with the X variable on the vertical axis and the Y variable (and its error bars) plotted on the horizontal axis.