
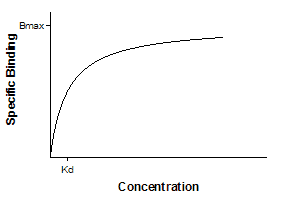
This curve is known as a rectangular hyperbola, binding isotherm, or saturation binding curve. Y is zero initially, and increases to a maximum plateau value Bmax.
This equation describes the equilibrium binding of a ligand to a receptor as a function of increasing ligand concentration.
•X is the concentration of the ligand.
•Y is the specific binding.
•Bmax is the maximum number of binding sites, expressed in the same units as the Y-axis (usually radioactive counts per minute, sites per cell, or fmol of receptor per mg of tissue).
•Kd is the equilibrium dissociation constant, expressed in the same units as the X-axis (concentration). When the drug concentration equals Kd, half the binding sites are occupied at equilibrium.
This equation also describes the activity of an enzyme as a function of substrate concentration. In this case, the variable labeled Bmax is really Vmax, the maximum enzyme activity, and the variable labeled Kd is really Km, the Michaelis-Menten constant.